Hundreds of people are dead and thousands missing in floods and landslides in Brazil. Three quarters of Queensland, Australia has been affected by flooding. 2010 was the wettest year on record and tied for the hottest. But, we are doing little to cut emissions and avert more intense warming and greater climate change because politicians and economists don't see the urgency for action. They might think about reconsidering.
Today a report was published in the journal Science showing that climate change coincided with the fall of the western Roman empire.
Anna Bligh the premier of Queensland, Australia reports that recovery from floods will be a task of postwar proportions.
"Queensland is reeling this morning from the worst natural disaster in our history and possibly in the history of our nation," she said. "We've seen three-quarters of our state having experienced the devastation of raging floodwaters and we now face a reconstruction task of postwar proportions."
Heavy flooding and landslides, among the deadliest in Brazil's history,have killed at least 361 people.
Several mountain towns near Rio de Janeiro were devastated as water and mud swept through the region.
Brazil's president, Dilma Rousseff, is due to visit a string of mountain towns devastated by floods and landslides, as the death toll from the disaster reached at least 361.
Heavy rains on Tuesday night triggered some of the deadliest landslides in Brazilian history, sending mud sweeping through three towns and burying entire families as they slept.
These floods follow a summer of flooding of biblical proportions in Pakistan and across Asia, that happened while record breaking temperatures and fires scorched Russia.
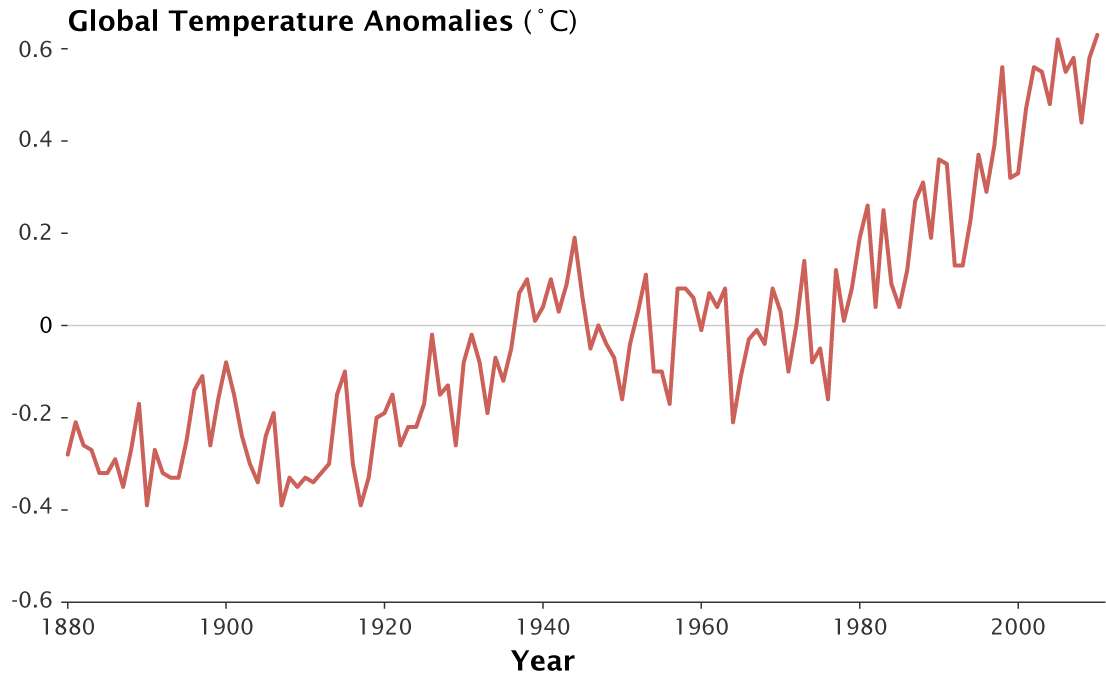
This week NOAA and NASA reported that 2010 tied 2005 for the hottest year on record and broke the record for the wettest.
In the Arctic, the extent of sea ice retreated to a record minimum and Hudson's Bay had open water at year's end.
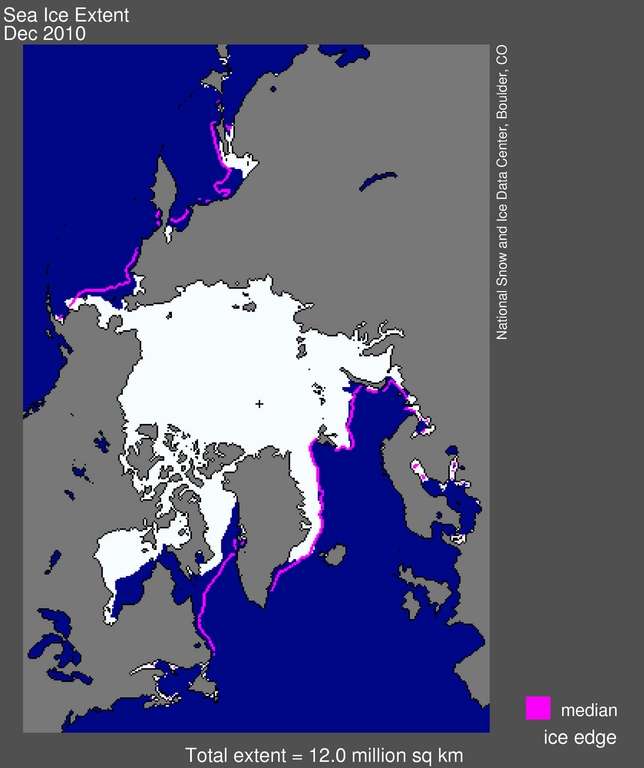
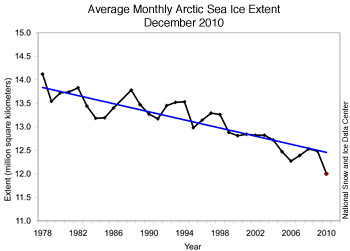
Arctic sea ice extent averaged over December 2010 was 12.00 million square kilometers (4.63 million square miles). This is the lowest December ice extent recorded in satellite observations from 1979 to 2010, 270,000 square kilometers (104,000 square miles) below the previous record low of 12.27 million square kilometers (4.74 million square miles) set in 2006 and 1.35 million square kilometers (521,000 square miles) below the 1979 to 2000 average.
As in November, ice extent in December 2010 was unusually low in both the Atlantic and Pacific sides of the Arctic, but particularly in Hudson Bay, Hudson Strait (between southern Baffin Island and Labrador), and in Davis Strait (between Baffin Island and Greenland). Normally, these areas are completely frozen over by late November. In the middle of December, ice extent stopped increasing for about a week, an unusual but not unique event.
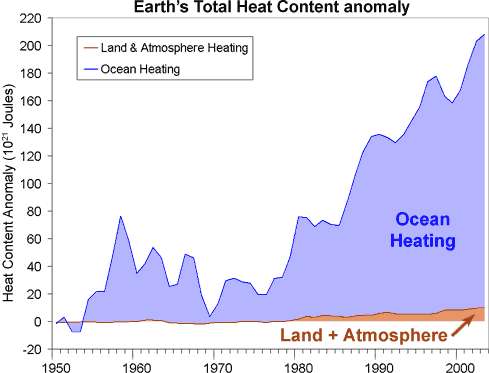
The increasing heat content of the oceans is a key factor affecting both the increase in extreme weather events and sea ice melting.
The broken record of broken weather and climate records would appear to be cause for strong political action to cut greenhouse gas emissions. However, that is not happening, in part, because prominent economists have estimated little damage to the U.S. economy from climate change.
More importantly, there’s a deeply rooted perception that the U.S. economy will suffer little damage from climate change. That view dates back to work from the mid-1990s by the influential Yale University economist William Nordhaus. Nordhaus took what was known about the science of climate change, then constructed an economic model to estimate the monetary harm. The model put the economic cost to the U.S. of raising global temperatures by 2.5 to 3 degrees C (expected by about 2100) at about ¼ to ½ percent of GDP. "There are both good and bad impacts, but they offset each other," explains Robert O. Mendelsohn, professor of forest policy and economics at Yale University and a frequent collaborator with Nordhaus.
The original economic model wasn’t complete, Nordhaus readily acknowledges. It didn’t include some sectors of the economy or "non-market" damages — effects that economists can’t easily quantify, such as loss of species. "We basically guessed on those, and that got us up to between 1 and 2 percent of GDP," says Nordhaus — still relatively small. Since then, Nordhaus has worked extensively on the analysis, but the general conclusion is the same. There’s little threat to U.S. GDP. "Do I think that the measured GDP of the U.S. or Britain or Japan is seriously at risk from global warming over the next 100 years?" Nordhaus asked in an interview. "No," though he adds that "GDP is a poor indicator of economic welfare."
I find it very strange in this era of globalization that economists could treat the U.S. economy as an island of stability in a global sea of instability caused by climate change. Other prominent economists think that Nordhaus has failed to calculate the costs of catastrophes correctly.
Harvard economist Martin Weitzman even suggests that the economic costs of a catastrophic event, however unlikely it might be, would be so enormous that it would overwhelm the whole analysis. "Perhaps in the end the climate-change economist can help most by not presenting a cost-benefit estimate for what is inherently a fat-tailed situation with potentially unlimited downside exposure," he writes.
In other words, it's like the mortgage securities market before the housing bubble burst. The best and brightest in the business said that mortgage backed securities were low risk investments.
Politicians and policy makers should not trust the advice of economists on complex scientific problems such as climate change. If history has relevant lessons, they should look to history.
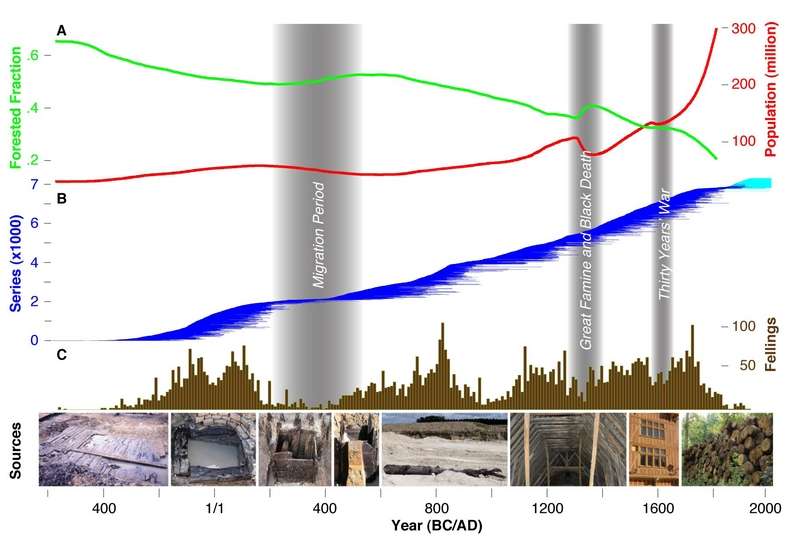
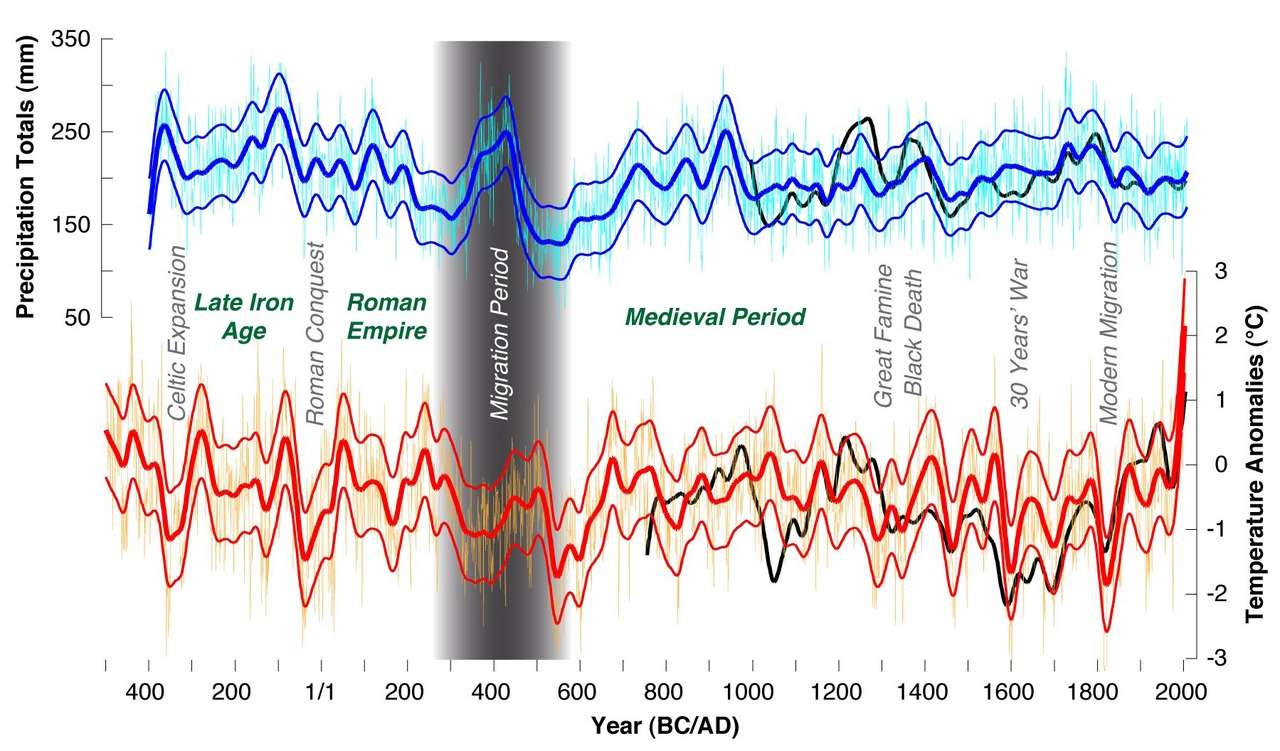
Climate variations have influenced the agricultural productivity, health risk and conflict level of preindustrial societies. Discrimination between environmental and anthropogenic impacts on past civilizations, however, remains difficult because of the paucity of high-resolution palaeoclimatic evidence.
Here we present tree ring-based reconstructions of Central European summer precipitation and temperature variability over the past 2500 years. Recent warming is unprecedented, but modern hydroclimatic variations may have at times been exceeded in magnitude and duration. Wet and warm summers occurred during periods of Roman and Medieval prosperity. Increased climate variability from ~AD 250-600 coincided with the demise of the Western Roman Empire and the turmoil of the Migration Period. Historical circumstances may challenge recent political and fiscal reluctance to mitigate projected climate change.
It is possible that the catastrophic floods in Australia and Brazil are just weather events associated with La Nina. In 1974 a strong La Nina and a tropical cyclone caused catastrophic flooding in Brisbane, Australia. However, record warm water temperatures around Australia are have increased the precipitable water (vapor) content of the atmosphere. Summer monsoon type rains intensify with warmer waters. This year, Brisbane had catastrophic flooding without a cyclone.
Global salinity changes in the oceans provide evidence that the earth's water cycle is changing. Increasing amounts of water vapor, evaporated from the oceans in the tropics and subtropics, are being transported towards the poles. These changes in the global water cycle may be, in part, responsible for the increase in extreme weather events and catastrophic flooding.
Using global datasets of in situ observations, we calculate salinity changes on ocean-density surfaces between 1970 and 2005. This reveals a global pattern of increased salinities near the upper-ocean salinity-maximum layer (average depth of ∼100 m) and decreased salinities near the intermediate salinity minimum (average depth of ∼700 m). The salinity changes imply a 3 ± 2% decrease in precipitation-minus evaporation (P-E) over the mid and low latitude oceans in both hemispheres, a 7 ± 4% increase in the Northern Hemisphere high latitudes, and a 16 ± 6% increase in the Southern Ocean since 1970. This pattern of increased precipitation at high latitudes and decreased precipitation in the subtropics is reflected in both land records and in the short satellite records. The quantification of the atmospheric signal of climate change on ocean salinity supports model projections, and extends the growing evidence for an acceleration of the Earth's water cycle.
The fall of the western Roman empire is associated with changes in rainfall and temperature across Europe. The recent global temperature records and changes in the global hydrologic cycle should concern politicians and policy makers.
Linking palaeo-demographic to climate proxy data challenges recent political and fiscal reluctance to mitigate projected global climate change (30), which reflects the common societal belief that civilizations are insulated from variations in the natural environment.
The historical association between European precipitation and temperature variation, population imigration and settlement desertion, however, questions the wisdom of this attitude.