"Eight years ago Michael Mann introduced a graph that became an iconic symbol of humanity's contribution to global warming."
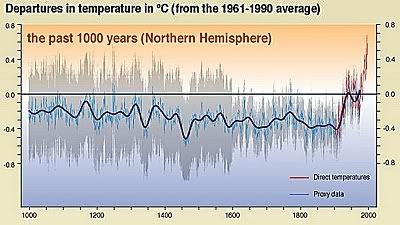
The famous "hockey stick", a graph that shows the 'drastic influence' of humans over the past hundred years, plots the Earth's surface temperature over the last thousand years. A quick glimpse of the graph shows temperatures relatively static -- that is until the industrial revolution moved into full swing. Around 1900 the temperatures take off like a rocket forming the image of a very long-bladed hockey stick.
In 2001, Mann's work achieved special prominence "when the Intergovernmental Panel on Climate Change (IPCC), an international body of climate experts, placed the hockey-stick chart in the Summary for Policymakers section of the panel's Third Assessment Report. (Mann also co-authored one of the chapters in the report.) It thereby elevated the hockey stick to iconic status--as well as making it a bull's-eye."
Thus, while those willing to face reality have accepted Mann's graph as potent proof of human-generated Global Warming, the miniscule but vocal collection of skeptics have jumped on the graph as evidence to the contrary.
In particular, "they cite the 'Little Ice Age' and 'Medieval Warming Period' as pieces of evidence not reflected in the hockey stick."
Mann asserts that both of these events were "examples of [extreme] regional, not global, phenomena" and would thus not be expected to show up in such data.
Now, new evidence has been revealed that supports Mann's assertion and essentially eliminates one of the skeptics primary rationales for dismissing the idea of human-induced climate change.
Ocean currents in the North Atlantic, dominated by the Gulf Stream, usually keep winter temperatures in western Europe mild by carrying warm water north from the tropics towards Europe and heating the westerly winds traveling from North America. Climate scientists have suspected that a weak Gulf Stream may have caused the 'little ice age', but until now there has been no direct evidence for this theory.
Jean Lynch-Stieglitz at the Georgia Institute of Technology in Atlanta and her colleagues calculated the strength of the Gulf Stream during the little ice age by looking at marine fossils in sediment cores taken from the Straits of Florida. Ocean circulation is driven by variations in water density caused by differences in temperature and salinity. These variations also affect the ratio of oxygen isotopes in marine fossil shells. By measuring these isotope ratios, the team calculated that the Gulf Stream was 10 per cent weaker during the little ice age (Nature, vol 444, p 601).
Moreover, the cooling that resulted was confined mainly to the northern hemisphere, says Lynch-Stieglitz - which indicates it was a regional effect. Michael Mann at Pennsylvania State University in University Park, who constructed the hockey stick graph, has always argued that if this were so, the little ice age would not show up on a global temperature record (New Scientist, 18 March, p 40).
"We're seeing a rearrangement of heat around the globe - so globally overall it's not colder," says Lynch-Stieglitz.
The Bottom Line: Using various methods for determining global temperatures up to 2,000 years back, the outcomes were consistent. "In each case, the outcome was clear: global mean temperature began to rise dramatically in the early 20th century. That rise coincided with the unprecedented release of carbon dioxide and other heat-trapping gases into the earth's atmosphere, leading to the conclusion that industrial activity was boosting the world's mean temperature. Other researchers subsequently confirmed the plot."
According to Mann, "From an intellectual point of view, these contrarians are pathetic, because there's no scientific validity to their arguments whatsoever," Mann says. "But they're very skilled at deducing what sorts of disingenuous arguments and untruths are likely to be believable to the public that doesn't know better."
Couldn't have said it better myself.
