Last week I detailed some research on the historical importance of Iowa results, National Polling, and New Hampshire polling in predicting the electoral outcome in New Hampshire. That analysis concluded that national polling results don't matter in New Hampshire. In fact, there is some evidence that national polling results may in fact be inversely related to success in New Hampshire:
Just for fun, let's see if the national polls begin to mean anything if we also know the New Hampshire polls. It turns out that if we look at all three variables -- New Hampshire polls, National polls, and Iowa results -- the National polls do have a statistically significant predictive impact, but that impact is negative. In other words, holding New Hampshire polls and Iowa results constant, we would tend to lower our prediction for a candidate's results in New Hampshire for each point he has in the national polls.
How can this be? It seems to be highly counterintuitive.
Well, here's the explanation. New Hampshire polls are a leading indicator to national polls. Voters are more engaged and more informed in New Hampshire than they are nationally. As the primary season progresses, voters continue to become better engaged and informed, until the actual voting takes place, when the voters are presumably as informed as they ever will be.
In other words, if a candidate is doing better in New Hampshire polls than he is in national polls, that suggests that as voters become more informed, they will continue to slide toward that candidate. At so the candidate will do well in the voting booth, at which point all voters are highly informed (relatively speaking, at least). On the other hand, if a candidate is doing better nationally than he is in New Hampshire, that suggests that the candidate may not hold up to scrutiny, that he may be trading primarily on name recognition, etc. His support is superficial.
That analysis was focused solely on the outcome of New Hampshire, and did not consider what happens in the post-New Hampshire universe. The basic questions we need to answer are as follows, with teases at my answers in parenthesis.
- Do New Hampshire results create a bounce in the national polls? (Yes, and a big one).
- Is it winning New Hampshire that matters, or the margin of victory that counts? (Finishing first is what counts).
- Do pre-Iowa national polls matter after New Hampshire? (Yes).
- Do Iowa results matter after New Hampshire?. (No).
Let me take a step back and describe my model, which takes place in several steps. As before, I'm looking at the results of all Democratic primary elections since 1972, excluding 1996 when there was no contest. This includes a total of 42 candidates between eight election cycles; I have added a few more minor candidates in, like Bruce Babbitt and Dennis Kucinich, since the last time around. I exclude 1992 from any analysis of Iowa results, because in that year Tom Harkin was allowed to win the state uncontested, and I exclude 1972 and 1976 from any analysis of New Hampshire polls, because I do not have New Hampshire polling data for those cycles.
Step 1. Translate Iowa polls into Iowa caucus results, accounting for second choices.
Our model for predicting the outcome in New Hampshire relied on actual Iowa caucus results, rather than Iowa polls. Apart from the inherent uncertainty of pre-election polling, we also need to account for another factor peculiar to Iowa, which is that candidates with below 15% support in their precinct are considered non-viable and their supporters must pledge themselves to other candidates.
We can see the importance of the viability threshold to some extent in 2004. The following numbers compare voters' preferences in an entrance poll held immediately before the caucus with the actual outcomes.
Kerry 35-->38 (+3)
Edwards 26-->32 (+6)
Dean 20-->18 (-2)
Gephardt 10-->11 (+1)
Kucinich 4--> 1 (-3)
Clark 1-->0 (-1)
Uncommitted 3-->0 (-3)
Notice that the top two candidates, John Kerry and John Edwards, picked up a combined 9 points in the caucus room. This support came mostly at the expense of the other candidates; very few voters walk into the caucus room truly uncommitted.
The key thing to understand about this phenomenon is that it begins to affect candidates at higher levels of support than you might think. For example, consider a candidate who has the support of exactly 15% of voters heading into the caucus. You might think "this candidate is at the 15% threshold, so his votes are safe". Actually, this is not the case. In fact, if his support is normally distributed between the different precincts, we would project that this candidate will be non-viable in exactly half the precincts. In fact, as Howard Dean demonstrated in 2004, even candidates in the low 20s may lose support rather than gain it as a result of the reallocation (especially if they're not anybody's second choice), whereas candidates in the single digits are liable to lose most if not all of their support.
Apart from these general rules of thumb, it is difficult to gauge the effects of the reapportionment precisely, but I have tried to do the best I can based on these CNN exit polling results as well as county-by-county results in 2004, which gives us at least some idea of how much results tend to vary from district to district.
Specifically, my formula operates by first re-assigning 3/4 of the undecided voters to specific candidates before they head into the caucus room, in proportion to the candidates' current standing in current Iowa polling averages. Then, I try and estimate in which percentage of the districts a given candidate will be viable given his level of support.
Finally, I assign the support of the non-viable candidates, plus the remaining uncommitted voters, to the viable candidates, based on polling data on voters' second choices. I was able to find second choice data in five recent polls, and it averages out thusly:
Iowa Second Choices - Current Polling Averages
Edwards 25.6
Obama 24.2
Clinton 20.2
Richardson 10.6
Biden 5.2
This gives a slight boost to John Edwards at the expense of Hillary Clinton. However, we should note that Edwards' standing among second-place voters, while certainly an advantage, is not quite the edge that it appears at first glance. This is because it's easier to be someone's second choice when you aren't their first choice, and since Edwards is showing slightly less support than Obama or Clinton right now in the polling averages, this works to his benefit. This is adjusted for in my estimates.
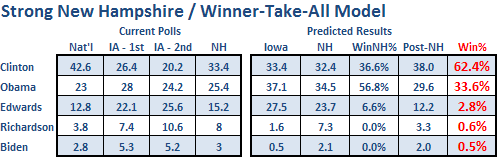
My current projection for Iowa based on this process is as follows. Current Iowa polling averages are in parenthesis.
Obama 37.1 (28.0)
Clinton 33.4 (26.4)
Edwards 27.5 (22.1)
Richardson 1.6 (7.4)
Biden 0.5 (5.3)
Note that even though Edwards picks up some support from this reallocation process, he does not pick up as much ground as Obama and Clinton, because if Edwards' support really is in the low 20's, he will likely find himself non-viable in 10-15% of districts. Thus, Obama's polling advantage of 6 points over Edwards translates into a caucus advantage of 10 points. The good news for Edwards is that, if he moves up even a little bit in the Iowa polls, he will get some bonus points by making himself viable in essentially all precincts.
Step 2. Predict New Hampshire results based on Iowa results
This is the step I described in detail in my previous diary. I'm now showing Obama as slightly more likely than Hillary to win New Hampshire, as a result of his move upward in some New Hampshire polls. Projected New Hampshire results follow.
Obama 34.5 (25.4)
Clinton 32.4 (33.4)
Edwards 23.7 (15.2)
Richardson 7.3 (8)
Biden 2.1(3)
Note that the projected Iowa results appear to affect things by roughly 10 points; we go from Clinton +8 in the current polling averages to Obama +2 in the projected final results. This is consistent with other analyses that project roughly an 11-point bounce from winning Iowa. However, it should be emphasized that it's not winning Iowa that counts so much as the margin of victory in Iowa. And this works for and against all the candidates. If Iowa is at all close on January 3rd, then we should expect a close contest in New Hampshire -- regardless of who actually won Iowa.
Step 3. Determine probability of winning New Hampshire based on projected results
Let me skip this one and come back to it.
Step 4. Predict post-New Hampshire national polls based on projected New Hampshire results
Fladem, who originally diaried on this subject at Open Left, presented a series of data on the first national polls taken after the New Hampshire primary. I attempted to predict the results of these polls based on a regression analysis that accounts for the following five variables: New Hampshire results, New Hampshire victory (this variable is set at '1' if the candidate wins New Hampshire and '0' otherwise), Iowa results, Iowa victory, and pre-Iowa New Hampshire polls.
It turns out that the Iowa numbers have no statistically significant effect on the post-NH national polls. What this means is as follows: Iowa matters, but only to the extent that it affects New Hampshire. After New Hampshire, Iowa does not matter at all. That is, if a candidate wins Iowa, he had better realize his bounce in New Hampshire, or he is never going to realize it.
Thus, I threw the Iowa-related variables out. It turns out that the primary drivers of post-NH support are, (1) whether or not the candidate WON New Hampshire, and (2) the candidate's standing in the pre-Iowa national polls. The margin of victory in New Hampshire also matters a bit, but only a tiny bit. The results of the regression analysis follow.
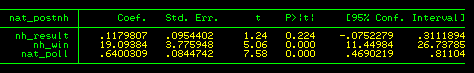
This is a pretty important conclusion. In Iowa, it's the margin of victory that counts -- who won Iowa barely matters. In New Hampshire, it's winning that counts -- the margin of victory barely matters. One good example of this comes from 2000, when Al Gore defeated Bill Bradley by a margin of 50-46 in New Hampshire. Not only was this much closer than the result in Iowa (which Gore won 63-37), but it was also a little bit better than Bradley had been expected to do based on New Hampshire polls. Nevertheless, Gore received a decent bounce from his victory in the national polls, and the Bradley campaign was left for dead. Likewise, Mo Udall's strong second place in 1976 in New Hampshire did not translate into any national support. A strong second can be meaningful in Iowa, but less so in New Hampshire, with McGovern in '72 being the one real exception.
This finding actually comports pretty well with the conventional wisdom, which is that Iowa picks out the losers -- that is, it narrows the field -- whereas New Hampshire picks out the winners. The results of winning New Hampshire have historically been very powerful, on the order of a 20-point bounce in the national polls, plus some bonus points for margin of victory. Another reason, by the way, why New Hampshire behaves this way while Iowa doesn't is because of the reallocation procedures in Iowa that I described earlier, which naturally tend to exaggerate the victory margins of the strongest candidates. It's actually fairly hard to have a super-close result in Iowa for this reason; wins tend to be at least reasonably definitive.
The other finding is that national polls do matter some after New Hampshire. Those results don't entirely evaporate. However, they are unlikely to be enough to keep a candidate ahead in the horse race if he loses New Hampshire. The only two candidates to win the Democratic nomination since 1972 in spite of losing New Hampshire were Bill Clinton (1992) and George McGovern (1972), and in each case their results in that state were considered moral victories (that's when Clinton got dubbed the "The Comeback Kid", in fact). EDIT: Oops, also Gary Hart in 1984. However, Hart got a huge bounce in the polls to the point where he moved ahead of Walter Mondale.
However, even if you accept my conclusion that Obama is presently more likely than Hillary Clinton to win New Hampshire, we know there is some uncertainty in this estimate. Therefore, it is not fair to assign him the entire 100% bonus from winning New Hampshire. We thus need to move back to Step 3, which is to translate the projected New Hampshire polling results into odds of victory in that state. This can be calculated by determining the standard error of the forecast, which in this case is generally around 7 points. This shows that the candidates' current chances of winning New Hampshire are as follows:
Obama 56.8%
Clinton 36.6%
Edwards 6.6%
Richardson 0.0%
Biden 0.0%
And thusly, the projected post-NH polling averages are as follows:
Clinton 38.0
Obama 29.6
Edwards 12.2
Richardson 3.3
Biden 2.0
These numbers are actually a little misleading, because they combine the cases where Hillary wins New Hampshire with those where Obama wins New Hampshire (and where Edwards wins New Hampshire). In fact, we can be almost certain that the polls won't look like this. If Obama wins New Hampshire -- and that's a big if -- we project the following result instead.
Obama 37.8
Clinton 31.1
Edwards 11.0
Richardson 3.3
Biden 2.0
On the other hand, if Hillary wins New Hampshire, we project a giant 30-point advantage for her in the polls. So we'll either have reasonably competitive race in which Obama has something of an edge, or a Hillary blowout.
Step 5. Predict chances of winning nomination from post-NH polls.
By means of a logistic regression, we can estimate a candidate's chances of winning the nomination based on their standing in the first post-New Hampshire poll. Sometimes New Hampshire results are determinative of the result, and sometimes they are not. For example, McGovern won in 1972 in spite of still just polling at 9% nationally after his "moral victory" second place finish in New Hampshire, whereas Gary Hart lost in 1984 in spite of moving ahead of Walter Mondale to 38% in the national polls after his surprise victory in New Hampshire. Therefore we see that it's possible for a candidate polling at as little as 9% to win, and as high as 38% to lose. The logistic regression accounts for all this information.
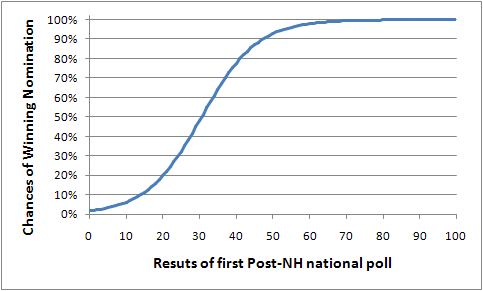
However, it's not just the absolute standing after New Hampshire that counts, but the relative one -- how far behind the front-runner are you? Our regression analysis counts for this variable as well.
One last adjustment is necessary because the results of this calculation are determined individually for each candidate, rather than collectively, which means that they may wind up being greater than 100% (in fact, they come out to about 110%). So, we simply prorate the results to make sure they add up to 100%.
Current Results
Based on current polling data, we are now showing that if the primaries began tomorrow, Hillary Clinton is still in the lead, but Barack Obama is close on her tail, with roughly a one-in-three chance of winning. John Edwards still retains a tangible chance of winning the nomination as well, but he is hurt by his poor standing in New Hampshire.
Let me briefly discuss the strategic implications for the three leading candidates:
Barack Obama
Chris Bowers, using some of these same techniques, has concluded that Obama is now the plurality favorite to win the nomination. Chris has boiled this down into three questions:
- Is Obama likely to win Iowa? Yes, probably.
- If Obama wins Iowa, is he likely to win New Hampshire? Yes, probably.
- If Obama wins New Hampshire, is he likely to win the nomination? Yes, probably.
I agree with Chris on his answers to each of these three questions. Obama is ahead in the Iowa polling averages right now, and the second-choice numbers might give him an extra point or two of cushion, so I think he's the favorite to win that state. If Obama wins Iowa, he is the favorite to win New Hampshire. And if he wins New Hampshire, he is the favorite to win the nomination.
However, while each of these steps looks good for Obama in the isolate, they do not look quite so good in the aggregate. For example, I'm showing that Obama will win the nomination 60 or 65% of the time if he wins New Hampshire, but not 100%. Similarly, while I do show him as the favorite in New Hampshire, his probability there is barely over 50%. Taken collectively, these things drive his number below Hillary's.
The other thing to recognize is that it's New Hampshire, rather than Iowa, that is a must-win state for Barack Obama. If Obama lose Iowa, but comes in a close second, he should still have a pretty decent chance to pull out an upset in New Hampshire. This is especially true if Obama finishes 2nd to John Edwards in Iowa with Hillary Clinton 3rd, a result which might actually help Obama more than it would John Edwards.
One final note about Obama. I have written before that if Obama pulls within the margin of error in New Hampshire, he becomes the favorite to win the nomination. This analysis actually bears that out. If we take the result of today's Mason-Dixon poll, which shows him within 3 points, and plug it into our model, it shows Obama with a 50.3% chance of winning the nomination to Hillary's 46.0%. So, if the polls that come out in subsequent days start to coalesce around that Mason-Dixon number, this should be considered very big news, and we may have a new frontrunner on our hands.
Hillary Clinton
Is Iowa a must-win state for Hillary Clinton? Obviously not, since our model is currently showing her losing Iowa, but still hanging on to win the nomination. Is New Hampshire a must-win state for her? She's definitely an underdog if she loses New Hampshire -- even if she wins Iowa. However, based on her margins in the national polls, she should still have perhaps a 35-40% chance at the nomination.
John Edwards
John Edwards faces a couple of problems from a statistical standpoint. #1 is that, if my analysis is correct, a narrow victory in Iowa doesn't count for all that much. There is definitely a bounce from Iowa results, but it behaves much more linearly; it is not a winner-take-all state like New Hampshire. Problem #2 is that someone has to finish in second place in Iowa. If it's Barack Obama in second, Obama may be helped more by finishing ahead of Clinton than he's harmed by finishing behind Edwards. If it's Hillary Clinton in second, Edwards just has a lot of math to overcome, since he's 18 points behind her in the polling averages in New Hampshire, which may be outside the range of the bounce he'd get out of Iowa.
I like Edwards' chances a little more than my model does. At the same time, the "Iowa-or-die" strategy tends to work a little better when we don't have two frontrunners as strong as we have in Barack Obama and Hillary Clinton. Edwards cannot emerge from a mediocre field, as Jimmy Carter did in 1976 or John Kerry in 2004, nor can he deliver a knockout blow with Iowa alone; he'll have at least one and possibly two strong competitors left.
The good news for Edwards is that this model is based on what would happen if the primaries began tomorrow, rather than what will happen in 3 weeks. For example, say that Edwards picks up 4 points in the polls between now and January 3rd, three of which come from Hillary Clinton and the other from Barack Obama. In that case, his chances of victory shoot up from 2.8% to 12.0%. So, he probably needs some momentum, but it's not too late for him to get it.
Comparison with Trading Markets
One final point is that the results from my model are a very good fit with current results from the futures markets at University of Iowa and Intrade.
		  Poblano    IEM       Intrade
Clinton 	  62.4	     58.5      62.9
Obama		  33.6	     31.3      30.0
Edwards 	  2.8	     8.8       5.0
Others		  1.1	     2.1       3.8
Thank you for your time, and I'll continue to update this analysis as we move closer to election day.
Addendum: One thing I might not have emphasized enough is just how sensitive this race is right now. For example, one measly point in Iowa right now is worth about an extra 3% to Obama's nomination chances, whereas one extra point in New Hampshire is worth about 4%. If Obama gets a mere two-point "Oprah bounce" in both IA and NH, his chances of winning increase to 44.8%, at which point the race is basically tied!
