Stephen Colbert once quipped, "It's not that I don't believe in climate change, it's that I don't believe in climate. Have you ever heard anyone say, 'How's the climate?' No! They say, 'How's the weather?'"
People often confuse climate and weather. They wonder how scientists can reliably predict climate 50 years from now when they can't predict the weather a few weeks from now. The answer is that climate and weather are different, and it's easier to predict climate than weather.
In the first diary of this two-part series, I talked about how climate models are constructed. In this diary, I'll address the all-important question: How well do they work? After showing you that they do a decent job (you'll see!), I'll talk about what they predict.
Weather is a short-term, local phenomenon. Climate is the average weather pattern of a region over many years. I may not be able to predict the weather in New York City on December 15, but I can predict with confidence that it will be colder than it is today, in mid-July.
A climate model could make the same prediction without a single past temperature reading. Basic orbital mechanics tell us that the northern hemisphere is colder in winter than summer.
As I explained in my previous post, a climate model is a mathematical description of the physics and chemistry of the climate system - for example, how heat is transferred from one place to another. The inputs to the model are things like solar radiation, volcanic eruptions, and human-produced greenhouse gas emissions. Based on these inputs and the laws of physics, the model predicts temperature, precipitation, and other aspects of climate.
Which brings me to how we know the models are credible.
What if the model inputs were actual observations from a time period in the past where we have full climate measurements? If the model is any good, it should accurately "hindcast" what we know the climate conditions were. In fact, hindcasting is the technique scientists use to evaluate models. If a model can accurately hindcast, we can have some confidence in its forecasts of the future.
In the graph below, the yellow lines show 58 temperature hindcasts from 14 different climate models. The thick red line is the average of all the hindcasts; the black line shows actual global temperature over the past century. Note how close the hindcast average is to actual temperatures. The models do a very good job of predicting 20th century climate.

Source: IPCC AR4 WG1 Figures [PPT file]
Averaging the predictions of different simulations usually gives a better prediction of real-world observations than any one simulation. The averaging minimizes any bias there may be in a particular approach. For example, scientists use many different models because they vary in their complexity - how many factors they take into account. A simple model can take just a minute to run, but a complex model requires serious computing power and time. Even complex models differ in the factors they consider.
For the same reason, many of the models have been run more than once, with some simulations including indirect effects of various aerosols, and other simulations calculating just the direct effects. The same goes for other factors such as ozone and land-use changes. Why do this? It gives modelers a sense of how "sensitive" the models are to various factors. It's clear from these tests that most of the warming comes from greenhouse gases. (But remember it's not because of models that we know today's warming is caused by the greenhouse effect.)
The issue of what to input when forecasting - for example, the level of carbon emissions to expect - can be tricky. Scientists thus look at different scenarios. For example, in the graph below, A2 is the most fossil-fuel intensive scenario and B1 the least. The scenarios [PDF] are based on "storylines" representing different demographic, social, economic, technological, and environmental developments (none of which includes initiatives to decrease greenhouse gas emissions).
Predicted Warming Under Various Scenarios
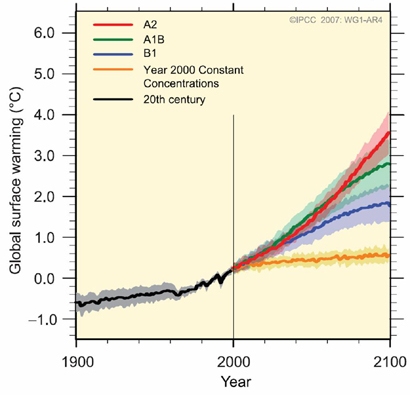
Source: Figure SPM-7 in the summary of the latest IPCC report [2.9 MB PDF]
The Year 2000 line shows what happens if greenhouse gas concentrations stay at current levels. Temperatures will continue to rise slightly because it takes some time for carbon emissions to translate into global warming. Scientists call this the "warming in the pipeline" or "warming commitment".
Note that despite differences and imperfections, the models are unanimous in predicting future warming.
To avoid dangerous climate change, temperatures cannot rise more than 2.3°F above what they are today. (For why, see this post by my colleague Bill Chameides.) Even the best business-as-usual scenario ("B1" in blue) crosses that tipping point. The implication is clear: we must cut our greenhouse gas emissions as soon as possible.
I hope this brief overview will help you explain to others why scientists have confidence in these models. What questions do you have?
Further Reading
And of course you can find this and other climate science and policy-related posts on Climate411
