"MONDALE LEAD OVER NEAREST RIVAL IN POLL SETS NONINCUMBENT RECORD"
NYT front page story, February 28th, 1984
"Hart leads Mondale 38-31"
CBS NYT Poll, March 5th -8th 1984
I have been following politics for over 25 years. In that time I have been consistently amazed at how few people actually understand how the nomination process works. What this diary is going to demonstrate is that National Polls are mostly meaningless. It's going to do this by reviewing the last 30 years of primary history.
And at the end of this diary you should ask why people get paid to write detailed analysis of meaningless national polls
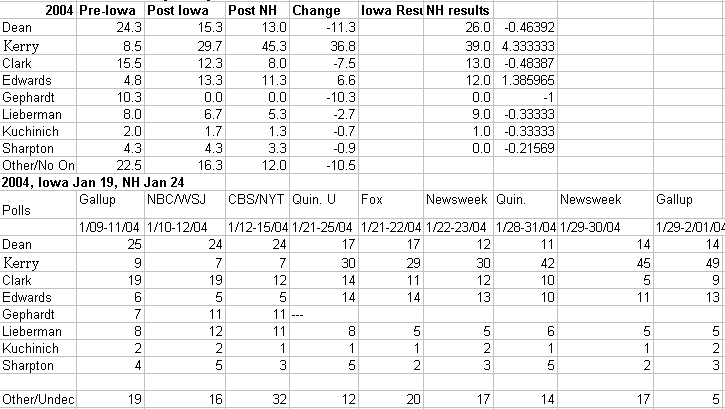
The first table summarizes the impact of the New Hampshire Results on National Polling. I did this by comparing the last national poll before Iowa and the first National Poll after New Hampshire. Since 1980 there have been four races with more than two candidates: 1984, 1988, 1992 and 2004. In those four races the winner of the New Hampshire Primary has received a 25 point bounce in the week after the New Hampshire Primary.
The numbers in this table were arrived at by comparing the last National Poll before Iowa with the first National Poll after New Hampshire. For example, in 1984 Hart won NH, and went up 36 points (from 2% before New Hampshire to 38% after New Hampshire. What I am trying to show is the combined effect Iowa and New Hampshire have on the National Race.

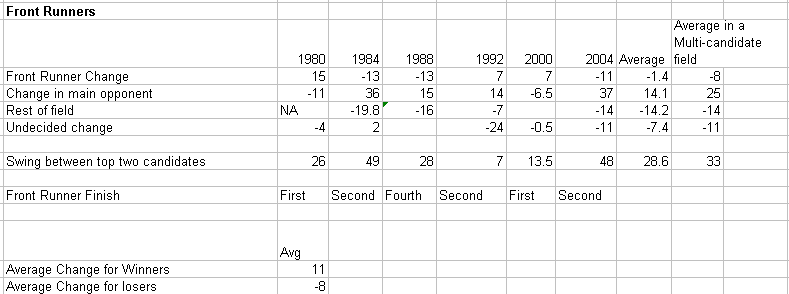
To some extent, though, this table fails to highlight the impact on front runners. So the table below shows the impact on front runners of New Hampshire. On average New Hampshire causes a 33 point swing between the top-two candidates!!! For example, going into Iowa, Dean was the front runner. After the results in New Hampshire, he lost 11 points in the National Race while Kerry went up by 37 points.

What this data also shows is the folly of states moving close to New Hampshire. Given the speed of the effect that NH has on National polling, states following New Hampshire closely will do little more than ratify the NH result.
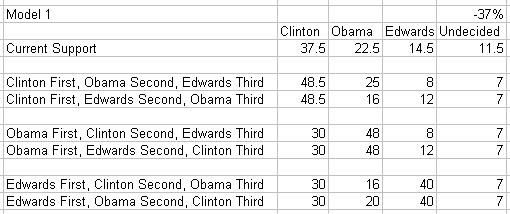
It is possible using this data to predict what the impact would be of one of the current candidates winning. This table shows what the national polls will look like given a certain order of finish:

For people in interested in the data, I have posted it here:
http://spreadsheets0.google.com/...
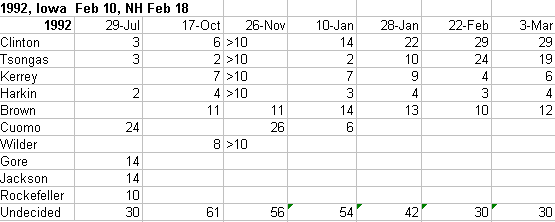
The data for 1984, 1992 and 2004 are post below:


