Those of who you read my comments and diaries know that I constantly describe the era we are in as a "Slow Motion Bust." A few days ago economist/blogger Prof. Brad DeLong published an excellent article that describes just what I have been trying to convey by that term.
Whoever inherits the White House on January 20, 2009 is likely to confront serious and urgent economic conditions unlike any we have seen in our lifetimes. For the mortgage crisis is only part of a bigger insolvency crisis that has already taken longer to unfold than most economic downturns in our history.
Below the fold I'll describe past "panics" or economic busts from the 19th century, to show you how quickly they unfolded. Then I'll post and discuss Prof. DeLong's article in detail. Finally I'll deal with the question, "where are we headed?" and point out a few things to look for.
Consider this, not a set of predictions for 2008, but rather a look at the Big Economic Issue that will dominate this year and the entire next Presidency.
[I apologize, this is a really long diary. I didn't intend for it to be that way, but to adequately explain my reasoning, I needed to add a lot of material.]
I. How is a "bust" different from a recession?
While a "recession" simply refers to any period of economic contraction, including slow periods that feature inflation, a "Panic" and a "bust" are typically described identically; for example:
the Great Depression had similar characteristics to the so-called panics or crises that had occurred in the United States and abroad in the previous century: a period of boom—accompanied by inflation—then a sudden and violent bust with prices and wages dropping quickly and banks and other businesses going belly-up.
And the online dictionary "Investor Words" defines a "panic" as:
Sudden, widespread fear of economic or market collapse, leading to massive bank deposit withdrawals and/or falling stock prices.
Notice the important difference: there is actual deflation of prices and wages, not simply decreased inflation. And once the deflationary spiral begins, it proceeds very quickly, although the aftereffects may linger for years.
As examples, let's look at several 19th and early 20th century "busts":
The Panic of 1873
began on October 1, in the disastrous failure of the banking firm of Jay Cooke & Co., of Philadelphia, the financiers of the Northern Pacific Railroad. Failure after failure succeeded, panic spread through the whole community, and the country was thrown into a condition resembling that of 1837, but more disastrous from the fact that much greater wealth was affected. Years passed [after the initial violent contraction of 1873] before business regained its normal proportions. A process of contraction set in, the natural change fron high war-prices to low peace-prices, and it was not till 1878 that the timidity of capital was fully overcome and business once more began to thrive.
The Panic of 1893
The economic collapse of the Philadelphia and Reading Railroads was the first step toward the Panic of 1893. A growing depression in Europe resulted in British investors selling their American investments and redeeming them for gold. This fostered a growing American gold loss, creating a panic.
By May 15, stock prices reached an all-time low. Many major firms; such as the Union-Pacific, Northern-Pacific and Santa Fe railroads; were forced to declare bankruptcy. Unemployment steadily grew, rising from 1 million in August 1893 to 2 million by January 1894 By the middle of the year, the figure had reached 3 million.
The Panic of 1907
The main cause of the crash was stock market and real estate speculation. Also contributing were attempted company takeovers and the San Francisco earthquake of 1906. Much of the real estate of San Francisco was insured by companies in London. Payouts to San Francisco drained money from the U.K., which raised interest rates there and in the U.S. But interest rates mostly rose due to borrowing for speculation, and the high rates and real estate prices then halted investment in capital goods. The U.S. stock market crashed on March 14, 1907 and then again after a failed attempt on October 16, 1907, of a scheme to corner the stock of the United Copper Company, which highlighted the close connections then among banks, trusts, and brokers. The panic began on October 18, 1907, following the collapse of United Copper share prices. On October 21, there was a run on the large Knickerbocker Trust Company, which then shut down.
To restore confidence, the banker chief J. P. Morgan, working together with the Secretary of the Treasury, organized some bank executives and the U.S. Treasury to transfer money to troubled banks and buy stocks. That soon ended the panic.
The Minneapolis Fed provides a "vivid description of the banks' quandary" during old-fashioned, pre-Federal Reserve busts:
[The banks] were so singularly unrelated and independent of each other that the majority of them had simultaneously engaged in a life and death contest with each other, forgetting for the time being the solidarity of their mutual interest and their common responsibility to the community at large. Two-thirds of the banks of the country entered upon an internecine struggle to obtain cash, had ceased to extend credit to their customers, had suspended cash payments and were hoarding such money as they had. What was the result? ... Thousands of men were thrown out of work, thousands of firms went into bankruptcy, the trade of the country came to a standstill, and all this happened simply because the credit system of the country had ceased to operate.
The highlighted part of the Minneapolis' Fed's description seems chillingly apt. That is why I contend we are not simply living through a garden-variety slowdown, but rather an event that hasn't been seen in the US since the Recession of 1938: a bust.
II. Brad deLong describes this Slow Motion bust.
By a "slow motion bust", I mean to suggest that the current situation is like the 19th-early 20th century "panics" described above, except that instead of unfolding quickly, the situation is unfolding at a snail's pace. Like an ageing behemoth of a warrior, the economy may need to sustain 1000 blows before it goes down, but that onslaught of blows is ever so gradually accumulating.
A couple of weeks ago, Prof. Brad DeLong described exactly how that is coming to pass. First, he identifies 3 classes of financial crises:
- Liquidity crises
- Solvency crises that are easily cured by easier monetary policy that boosts asset values
- Solvency crises that aren't easily cured by easier monetary policy
that he then describes in fuller detail:
A full-scale financial crisis is triggered by a sharp fall in the prices of a large set of assets that banks and other financial institutions own, or that make up their borrowers' financial reserves. The cure depends on which of three modes define the fall in asset prices.
The first -- and "easiest" -- mode is when investors refuse to buy at normal prices not because they know that economic fundamentals are suspect, but because they fear that others will panic, forcing everybody to sell at fire-sale prices. [My note: in this mode, unlike modes 2 and 3, underlying assets are worth more than accumulated debts, but they are not "liquid" -- they cannot be sold at other than discount prices prior to the date at which payments on debt become due].
The cure for this mode -- a liquidity crisis caused by declining confidence in the financial system -- is to ensure that banks and other financial institutions with cash liabilities can raise what they need by borrowing from others or from central banks.
....
In the second mode, asset prices fall because investors recognize that they should never have been as high as they were, or that future productivity growth is likely to be lower and interest rates higher. Either way, current asset prices are no longer warranted.
This kind of crisis ... [is] because the problem is that banks aren't solvent at prevailing interest rates. Banks are highly leveraged institutions with relatively small capital bases, so even a relatively small decline in the prices of assets that they or their borrowers hold can leave them unable to pay off depositors, no matter how long the liquidation process.
....
The problem is not illiquidity but insolvency at prevailing interest rates. But if the central bank reduces interest rates and credibly commits to keeping them low in the future, asset prices will rise. Thus, low interest rates make the problem go away....
....
The third mode is like the second: A bursting bubble or bad news about future productivity or interest rates drives the fall in asset prices. But the fall is larger. Easing monetary policy won't solve this kind of crisis, because even moderately lower interest rates cannot boost asset prices enough to restore the financial system to solvency. [My note: This mode is the full-fledged deflationary spiral and liquidity trap].
He then describes how the problem has slowly worsened over the last year -- in other words, it has become "a slow motion bust." Let's first note that housing prices probably peaked nationwide by early 2006. By February 2007, as noted by Calculated Risk, there were serious problems with subprime mortgage- backed investment paper. By August, the problems had spread far beyond subprime mortgages, and banks and hedge funds were facing liquidity problems. As DeLong continues:
Since late summer, the US Federal Reserve has been attempting to manage the slow-moving financial crisis triggered by the collapse of the US housing bubble.
At the start, the Fed assumed that it was facing a first-mode crisis -- a mere liquidity crisis -- and that the principal cure would be to ensure the liquidity of fundamentally solvent institutions.
But the Fed has shifted over the past two months toward policies aimed at a second-mode crisis -- more significant monetary loosening, despite the risks of higher inflation, extra moral hazard and unjust redistribution.
....
Now policymakers are yet considering the possibility that the financial crisis might turn out to be in the third mode.
Bingo! Prof. DeLong's article describes perfectly why I have been calling this a "slow motion bust". Very much unlike its 19th and 20th century predecessors, instead of going from boom to deflationary spiral suddenly, in a matter of mere months, this bust began to implode a year ago, and bit by bit financial assets (what bloggerRuss Winter calls "fictitious capital") are being written down or written off entirely. Only now are serious financial thinkers beginning to worry about the "third mode" of a deflationary spiral.
III. But what about food, energy, commodity inflation?
But wait a minute! you say. After all, bonddad has diaried about rampant food, energy, and commodity inflation. In fact, so have I. Doesn't that mean this diary is wrong?
Well, in the first place, it could be that what is different this time is that wages will stagnate or decrease as asset values decline, but that prices for necessities like food, energy, and medical care continue to increase. However, if the recession is not confined to the US, but spreads globally, then the demand for things like energy and commodities will contract absolutely. Not to mention that much of the price increases in things like oil is due to financial speculation itself!
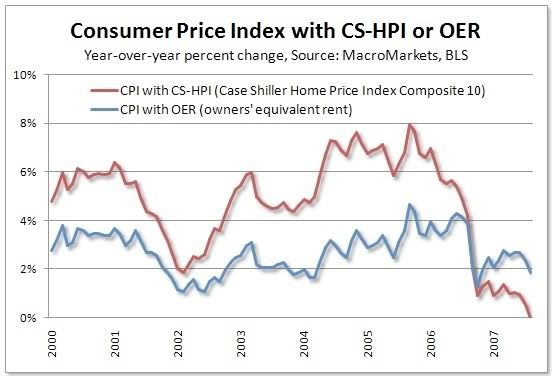
That is why the chart below, courtesy of Tim Iacono of The Mess that Greenspan Made, is so riveting. It shows CPI inflation, including food, energy, and also including house prices instead of "owner's equivolent rent" (that so drastically underestimated inflation in the past few years during the housing bubble). When you include housing prices, the housing bust has such a dramatic impact on the overall inflation rate that we are on the cusp of entering deflation right now!:

IV. What I'm watching for
Last week's data reflecting manufacturing decline, mediocre retail sales , a continuing trend of more jobless claims, and worst of all, awful new jobs creation and increasing unemployment in the face of less labor participation, altogether are strong signals that we have already entered a recession.
So, where to from here?
I wholeheartedly agree with Mike Shedlock a/k/a Mish when he says
What the printing like mad crowd is talking about is M3 (credit) which indeed has been soaring....
[But people need to] ... understand the difference between money and credit. While credit acts like money in most circumstances, when debt can no longer be serviced, the difference is enormous.
Right now we are seeing huge warning signs that debt can no longer be serviced. Those signs are soaring foreclosures, soaring bankruptcies, soaring defaults in credit cards, and a slowdown in consumer spending.
So, the question becomes, how bad does the debt implosion get? And how quickly?
The closest thing we have to a crystal ball is the bond market, in particular the yield curve, which has a very good although not perfect record of predicting economic conditions about 12 months out. I pay particular attention to 2 things: (1) the interest rates necessary to service long-term money (which tells me if money is "easy" or "tight" relatively speaking), and (2) the shape of the yield curve, and its movement over the last 12 months. Right now both of those are signaling continued weakness, but no awful contraction imminently. In fact, the yield curve continues to indicate that there will be a respite in the Slow Motion bust around election day.
Here's a graph of 10 and 30 year treasury yields:

What is important here is that the 2003 low in interest rate yields is still intact. That means that consumers have not been given another chance to refinance, suggesting a consumer slowdown will continue. But on the other hand, if we were to move into DeLong's "Type 3" solvency crisis, I would expect both rates to be significantly lower than their 2003 lows. So I will be watching to see whether that happens.
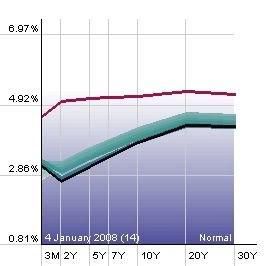
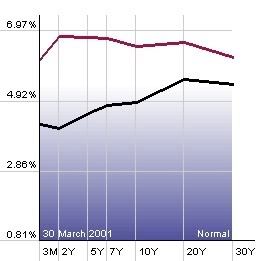
Now, here are 2 graphs, each showing the current yield curve (blue) at the onset of recession now (left) and in 2001 (right) compared with the yield curve at its highest point 6-10 months previously (red).


First of all, note how similar the left and right charts are, suggesting as of now that the course of this recession may be similar over the next year to the course of the last one (i.e., shallow). Also, note that the current yield curve is more positively sloped left to right than the "flat" yield curve 6 months ago. That suggests an economic expansion about 12 months from now. Also, interest rates across the board are lower than they were 6 months ago, indicating that the price of money is "cheap." With inflation running at 4%+, money is literally being given away! That tells me there is likely to be a respite in the bust about 9 months from now, give or take (right around election day). I will be watching to see if the curve flattens again, or stays positive, and whether money stays cheap or not.
At this point, there is very little we can do until a new, hopefully democratic Administration takes office in 2009, except hope that policymakers don't make any really stupid moves, and cross our fingers and pray that the "Type 3" solvency crisis doesn't show up. Because if it does, then it's something similar to 1929-32 all over again.


