Hi all,
This will be the first of what I hope will become a semi-regular installment of electoral projections for the general election. For the time being, I am including matchups of John McCain against both Hillary Clinton and Barack Obama.
I have a couple of goals in mind with these projections, but the basic idea is to assess state-by-state general election polls in a probabilistic manner. For example, right now there are three recent Wisconsin polls that show Obama beating McCain by an average of 4 points. How does this translate in terms of the general election, which is still more than 250 days away? Is Obama a massive favorite over McCain -- or is it closer to a toss-up? What about states for which we do not have any polling data -- can we extrapolate projections for them somehow? And what about states where we have polling data, but it might be an outlier -- for example, the Rasmussen poll that shows Hillary losing Maryland to McCain, or the Survey USA poll that shows Obama winning Massachusetts by just 2 points? These are the sorts of things this exercise is intended to address.
The first step was simply to collect as many general election head-to-head polls as possible. There are a couple of good resources for this; principally presidentelectionpolls.com, Wikipedia, Survey USA and Rasmussen.
The complete list of surveys included in the dataset follows. I included the most recent poll from each survey agency, using Labor Day as a cut-off, with the caveat that the pollster had to survey both the Obama-McCain and Clinton-McCain matchups. Although Labor Day might seem like a rather lax cut-off point, you should see that the vast majority of the polls are more recent than that (all of the Survey USA data has been 'refreshed' within the past few weeks, for instance). Anyway, it's helpful to have more data to work with rather than less, and it would be somewhat arbitrary to say that a poll conducted 260 days from the general election should count, whereas one conducted 320 days from the general election should not count.
State	Agency	Date Posted	Obama	Clinton
AL	SUSA	2/17/2008	-24	-20

AZ	Rasmu	11/28/2007	-22	-23

CA	SUSA	2/17/2008	+27	+23
CA	Field	2/1/2008	+7	+2

CO	Rasmu	2/11/2008	+7	-14

CT	Quin	12/7/2007	+5	+8

FL	Rasmu	2/16/2008	-16	-6
FL	Quin	2/12/2008	-2	-2
FL	PBP	11/7/2007	-2	-1

IA	Selzer	2/21/2008	+17	-9
IA	Rasmu	2/18/2008	+3	-10
IA	SUSA	2/17/2008	+10	-9
IA	R2000	11/14/2007	+10	+8

IL	R2000	1/24/2008	+21	+14

IN	SUSA	2/5/2008	-10	-9

KS	SUSA	2/17/2008	-6	-24

KY	SUSA	2/5/2008	-29	-10

MA	SUSA	2/17/2008	+2	+9

MD	Rasmu	1/8/2008	+6	-2

MI	Rasmu	2/17/2008	+8	+0
MI	Selzer	12/12/2007	+8	+4

MN	SUSA	2/17/2008	+15	+4
MN	Rasmu	2/16/2008	+15	-5
MN	MPR	1/27/2008	+13	+10

MO	SUSA	2/17/2008	+6	+7
MO	Rasmu	2/12/2008	-2	-1
MO	R2000	1/24/2008	+5	+1

NH	Rasmu	2/11/2008	+13	+2
NH	R2000	12/12/2007	+10	+6

NJ	Quin	2/18/2008	+6	+7

NM	Rasmu	2/23/2008	+0	-12
NM	SUSA	2/17/2008	+15	+3

NV	Rasmu	2/12/2008	+12	-9
NV	M/D	12/5/2007	-7	-17
NV	R2000	11/19/2007	+3	+0

NY	SUSA	2/17/2008	+21	+21
NY	Siena	2/14/2008	+7	+7
NY	Quin	9/30/2007	+8	+17

OH	Rasmu	2/24/2008	-1	-3
OH	SUSA	2/17/2008	+3	+10
OH	Quin	2/12/2008	-2	-1

OK	Sooner	1/30/2008	-28	-21

OR	Riley	2/26/2008	+8	-8
OR	SUSA	2/17/2008	+1	-8
OR	Rasmu	2/13/2008	+9	-3

PA	FrMar	2/18/2008	-1	+0
PA	M-Call	2/17/2008	-3	+1
PA	Rasmu	2/14/2008	+10	-2
PA	Quin	2/12/2008	+1	+6

RI	Brown	2/10/2008	+12	+11

TN	MTSU	10/27/2007	-9	-3

TX	SUSA	2/25/2008	-8	-6
TX	CNN	2/20/2008	-8	-13

VA	Rasmu	2/19/2008	-5	-10
VA	SUSA	2/17/2008	+6	-3

WA	SUSA	2/4/2008	+17	+0

WI	Rasmu	2/24/2008	+1	-12
WI	SUSA	2/17/2008	+10	-7
WI	Vision	2/10/2008	+1	-5
One nice thing, by the way, is that these tend to be pretty good pollsters who have conducted general election polls this early ... no Zogbys or ARGs mixed in there.
The next step was to develop a regression model that predicts the poll results based on several input variables -- analogous to what I did here for the February primary and caucus states. This allows us to do a couple of things: (1) estimate results for states with no polling data at all; (2) give us another data point for states with limited polling data. For example, right now our only Kentucky poll shows Obama trailing McCain by 29 points, whereas our only Tennessee poll shows Obama trailing McCain by 9 points. Kentucky and Tennessee are fairly similar, and thus it seems unlikely that there is a 20-point gap between the two states. Adding an estimate from the model allows us to regress to the mean and correct for some of this disparity.
(Literally speaking, what I do with the results of the regression analysis is to treat them as another poll. So in states with no polling data at all, this becomes the only 'poll'; in other states, it is incorporated into the polling averages, with correspondingly less weight depending on the number of actual polls that we have).
As opposed to my primary state model, this one is much simpler, and necessarily so as my primary state model was somewhat overdetermined (e.g. it included too many variables for too few data points, which led to some wacky predictions). Specifically, the variables I included were limited to the following:
- John Kerry vote margin, 2004. Should be fairly self-explanatory. There is one slight adjustment to this, which is that I subtracted 4.7 points from Kerry's margin in Massachusetts, and added 4.7 points to Kerry's margin in Texas, to account for my estimate of home-state effects. (Since 1988, Presidential candidates fared about 4.7 points above trend in their home states as compared with other recent elections). Clinton's model was somewhat more sensitive to the Kerry variable than Obama's, although the difference is not to be overstated.
- Fundraising. I used state-by-state fundraising data from the FEC website for Obama, Clinton and McCain, respectively. The Obama model, naturally, gets the Obama fundraising data, and the Clinton model uses the Clinton fundraising data; they both use the McCain fundraising data. The numbers were interpreted in terms of dollars raised per 2004 general election voter. In Colorado, for example, Obama has raised 87c per general election voter, Clinton 57c, and McCain 28c. While not massively statistically significant, these numbers did increase the explanatory power of the model by a few percentage points.
- Percentage of Baptists, especially Southern Baptists (Obama only). In my primary state model, I found that Obama performed systematically worse in states with high concentrations of Southern Baptists. This trend carried over to Obama's general election model. Estimates of religious participation are hard to come by, but after some experimentation, I used a combination of data from two sources: The Southern Baptist Convention statistics that I used before, as well as self-reported Baptists from the American Religious Identification Survey. More specifically, Southern Baptists were given full weight, while non-Southern Baptists were given half-weight; this roughly maximized the explanatory power of the model. Note that this variable is not present in the Clinton model; it is only statistically significant in the Obama model. This is the one group of voters that Obama can expect to perform significantly worse with than Clinton in the general election; on the other hand, he should perform as well or better than her among most other groups of voters.
- LDS (Mormon) voters. This is a somewhat subjective adjustment, by my model was turning out implausible results for Utah (and to a lesser extent Idaho, which also has a fairly high concentration of LDS voters). I was quite certain that this problem would correct itself if we had some Utah polling data, but unfortunately, the McCain-Clinton and McCain-Obama matchups have not yet been surveyed in Utah. So what I did was to "cheat" a little bit and use the Clinton-Guiliani results (Giuliani +36) from this Rasmussen Reports survey as a proxy for Clinton-McCain. Rasmussen did not survey Giuliani-Obama in Utah (much less McCain-Obama), but I saw that he ran 5 points better against McCain than did Clinton, so I assumed that he'd also run 5 points better against Giuliani/McCain, or that his margin would be -31. With this phantom poll in place, the percentage of LDS voters showed up as modestly statistically significant in both the Clinton and Obama models.
The model generally produced results that I consider to be fairly intuitive. Also, as a brief aside, I did not apply the model for the District of Columbia, which has very idiosyncratic fundraising data; I simply assumed that both Clinton and Obama would win by an 81-point margin, as Kerry did in 2004.
So, for each state, we have the regression analysis "poll", plus however many public surveys were included in my dataset. These numbers were averaged together.
However, the work is not done, as there are at least three other ways in which the polling data may differ from the eventual results.
- Sampling error. This applies a standard margin of error calculation to each state. I assume that each survey (including the regression-based "poll") has a sample size of 500, and then applied a random margin upward or downward to each poll based on 5,000 separate simulation runs by using a normal distribution.
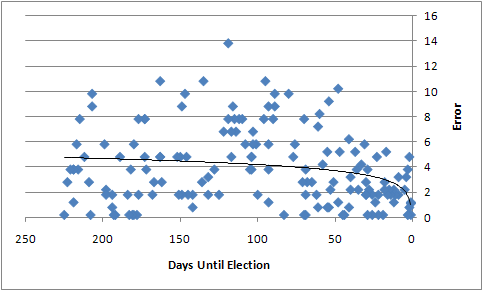
- State-specific movement. Apart from the sample variance itself, there is also "real" variance from state to state as a result of the events of the campaign. The way that I estimated this was to take all 2004 state-by-state polling data from electoral-vote.com, and determine by how many points these polls missed the eventual Bush-Kerry margin. Although it's a little hard to see from the graph below, the noteworthy features are that (i) the polls do become slightly more accurate as we move closer to the election, particuarly within the last ~50 days, and (ii) even on election day itself, the average error is somewhat larger than what you'd expect based on sample variance alone -- that is, polls are inherently an imperfect predictor of election outcomes, no matter how large their sample size. So, I add an additional random variable to account for these effects. This variable depends, in part, on the number of days until the election. Since we're pretty far from the election now, the magnitude of this randomness is fairly high right now.

- National movement. Apart from movement in specific states, there are also broader trends that affect things at the national level (and thereby affect all states individually). I determined these trends based on an analysis of national polls from Real Clear Politics (see graph below), and added an additional random element to the polling averages accordingly. Just like the state-specific trends, the degree of randomness is time-sensitive; it is quite high right now, 252 days from the election. Note that these trends are applied to all states at once; thus we end up with outlier scenarios where there is massive national movement and Obama wins all states except Utah, Arizona, and Oklahoma, or loses all states except for Rhode Island and Illinois. Of course, these sorts of outcomes represent just a small percentage of our simulation runs.
It can reasonably be argued that I'm essentially double-counting the amount of variance by accounting for both state-specific and national movement. That is, some of the error in state-by-state polls is because of national movement, rather than anything specific within that state. However, I have chosen to account fully for both sources of error, because (i) this is the more conservative assumption, and (ii) I suspect that 2004, where voters divided into Bush and Kerry camps early, was inherently a more stable sort of election than 2008 is likely to be.
Now, for the fun part. As I've alluded, I ran 5000 separate simulation runs for each candidate, based on the polling averages plus accounting for the different sources of error/variance that I just got finished describing. The results of those simulation runs are below.

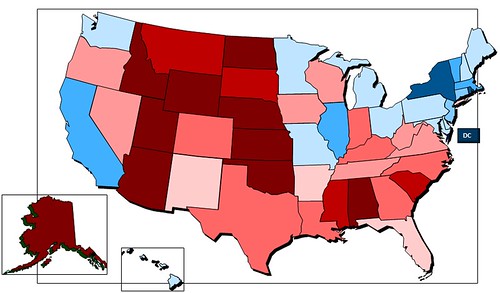
First, the topline results. I show Obama as having a 64% chance of winning the election, gaining an average of 289 electoral votes, and Clinton a 38% chance, gaining an average of 239 electoral votes. So, I estimate that there is roughly a one-in-four chance that Clinton would lose the election when Obama would win it.
One important "discovery" is that the way that the projected margin in the electoral vote is wider than that in the popular vote. I am showing Obama winning 53.7% of the electoral vote on average, as compared to just 50.5% of the two-way (Obama + McCain) popular vote. For Clinton, on the other hand, I am showing her winning 49.3% of the two-way popular vote -- not that different from Obama -- but just 44.4% of the electoral vote. Thus, if these simulations are right, Obama is liable to be helped by the electoral math while Clinton is liable to be harmed by it.
Why is this the case? Let's look at the relative performances of Clinton and Obama in different states. Stronger Clinton states are in yellow/brown, and stronger Obama states are in green.
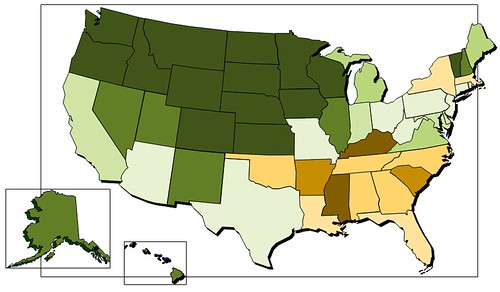
Clinton can be expected to substantially outperform Obama in the Deep South. However, this is largely irrelevant to the electoral math, because with the potential exception of Arkansas, those states are out of reach to Democrats in any sort of competitive election. She does also perform a little better than Obama in Florida, which is her most tangible advantage, although the difference is not enormous. She also can be expected to perform very slightly better in New York and Massachusetts, two states that should not be competitive. In other words, most of the extra votes that Clinton receives -- principally from white, religious Southerners -- are wasted, as most of them do not come in swing states.
Obama, on the other hand, can be expected to run better than Clinton just about everywhere else. The two candidates are essentially tied in Ohio, Pennsylvania, and Missouri; Obama has a somewhat more significant advantage in Michigan. However, it's the huge block of states to the north and west of Illinois that are the key. The model expects Obama to win Nevada, Colorado, Wisconsin, Oregon, Iowa and New Mexico, but Clinton to lose them. It also almost has Obama winning Virginia (but Clinton a longshot). Meanwhile, Clinton may have to play defense in a whole array of Kerry states, including the aforementioned like New Hampshire, Washington and Maine, that Obama should be able to win more easily.
In other words, Obama is fighting the election mostly on red turf, and Clinton mostly on blue turf; that is inherently a much stronger position. The model even shows Obama sort of literally expanding the Democratic frontier, with the group of prarie states running from North Dakota down to Kansas potentially being competitive, as well as Montana, and perhaps even Alaska and Indiana. This finding will seem a bit controversial, I am sure -- and the model will quickly correct itself if we get some polling data in these states to the contrary. But Obama trailed by just 6 points in the one prairie state that has been polled (Kansas), and he has massive leads in states like Minnesota, Colorado and Iowa that border these states and have broadly similar demographics. Moreover, he won the primaries and caucuses in those states by overwhelming margins, and he's outfundraised McCain in each of them (in fact, Obama has outfundraised McCain in 47 of 50 states, the exceptions being Arizona, Louisiana, and Michigan).
Obama has a lot of ways to win the election. He can get to 269 electoral votes by winning Ohio or Missouri or Virginia -- he needs just one of these -- or by winning two out of three of Colorado, Nevada, and New Mexico. Note that I'm excluding Florida, which is a state that I think Obama should largely ignore.
Clinton's strategy is a little more conventional. Florida is within reach for her, as are Ohio and Missouri. She could also get enough electoral votes by carrying all Kerry states plus Arkansas and New Mexico. The problem, however, is that Clinton would have to play a lot more defense. We show her as a rather heavy underdog in Oregon, Iowa and Wisconsin, and Michigan is likely to be more vulnerable for her than it would be for Obama. She has a lot of ways to lose the election, in other words.
UPDATE: Here are the more traditional red-blue maps, with Obama's scenario on top.
Also, yeah, we lost Iowa in 2004. How soon one forgets, golldarnit. But since this looks to be a very strong state for Obama, the scenarios I outline below should basically be valid.
Obama vs McCain
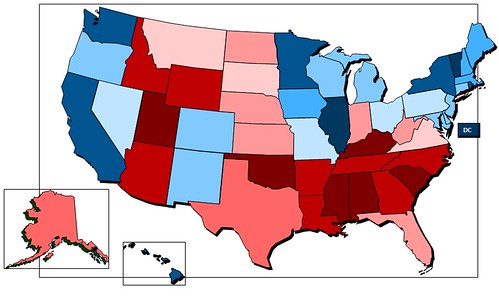
Clinton vs McCain