Like the Blowout Principle is the mathematical undermining of the Slate delegate calculator, the Closed/Open Principle is undermining turnout predictions for the remaining states.
A couple weeks ago, I wrote a diary that attempted to predict turnout, but it wasn't a full analysis. I believed it a sounder model than those predicters who were merely throwing spaghetti at the wall, because I tied the turnout to congressional districts and past performance in the 2008 primary cycle, distinguishing between closed and open/semi-open primaries and comparing like to like.
Still, I began seeing different numbers and methods around the web. Over at Open Left, fladem tied predictions of turnout straightforwardly to 2004 GE Kerry performance. PA turnout was pegged at 75% of 2004 Kerry GE turnout, based on an average of 64% of Kerry turnout in primaries and 80% of Kerry turnout in primaries post-Super Tuesday. I wanted to take a closer look because some 2004 GE states were battlegrounds and others were not.
Michael Barone, favorite slurp target of belligerently non-elite Morning Joe Scrangstownacola Scarborough, tied turnout predictions to things he pulled out of his ass. Or maybe he asked The Hacktastics (Clinton subsidiaries Sean Wilentz and Craig Crawford) to cook up some numberzes.
The bottom line was I didn't like my first pass because I was uncomfortable without looking closer at blue-ness of the states and wanted a deeper look. I am suspicious of tying turnout in a contested primary to turnout in the 2004 general election, when many states were not contested (which affects the average).
Also, the recent PA registration surge made me re-test my own theory and find it incomplete. [With Friday, April 11 as the NC registration deadline (the numbers will be updated for a few days afterward), PA leads in Dems by about 391,000 over Dems+Indies in NC (4,190,064 to 3,799,076).]
First, a few observations.
Observation #1: Three PA-bordering closed primary states and nearby Connecticut had the following turnout of registered Dems (and there were big drives/big publicity in these states too):
Delaware - 37.3% of registered Dems, 48.2% of Kerry GE vote
New York - 37.5%* of registered Dems, 43.2% of Kerry GE vote
Connecticut - 51.1%* of registered Dems, 41.5% of Kerry GE vote
Maryland - 49.3% of registered Dems, 65.8% of Kerry GE vote
*record
Observation #2: In 2002, Pennsylvania turned out roughly 1,240,000 votes in a highly contested Rendell-Casey gubernatorial race.
Observation #3: Fladem says PA = 75% of Kerry vote and thus just over 2.2M. That's not inconceivable, but you have to put it in closed primary context and see why it's a high prediction.
Observation #4:
In closed primaries, the average turnout has been 55.39% of that state's 2004 Kerry GE vote.
In semi-open primaries, the average turnout has been 63.46% of that state's 2004 Kerry GE vote.
In open primaries, the average turnout has been 74.99% of that state's Kerry GE vote.
Some may say that the 6 week focus will inflate the number over other averages, and this is partially persuasive to me. But it's also persuasive to me to say that these primaries are still not generating as much as the Kerry vote, meaning we can't get too carried away with equating a primary to a general. Many of these numbers in the 40% range are record primary turnouts. Record Democratic primary turnout was set in 12 states through Super Tuesday: Alabama, Arizona, Connecticut, Georgia, Illinois, Massachusetts, Missouri, New Hampshire, New Jersey, New York, South Carolina and Utah. Since these records are still mostly in the 25%-50% range, it's not ok simply to blithely say PA will be higher than 50% of registered Dems without a lot of supporting evidence/argument.
CLOSED PRIMARIES
State 2008 Turnout #RegDems %RegDTurnout
Arizona 455,635 904,741 50.4
Connecticut 355,561 695,894 51.1
Delaware 96,374 258,300 37.3
Maryland 878,174 1,782,541 49.3
New York 1,862,445 4,966,942 37.5
Oklahoma 417,207 1,012,594 41.2
avg. = 44.5%
Pennsylvania as of apr 6 4,190,064
Kentucky as of mar 17 1,614,250
Oregon as of Feb 775,119
South Dakota n/a yet
CLOSED PRIMARIES
State 2008 Turnout #KerryVotes %ofKerryTurnout
Arizona 455,635 893,524 51.0
Connecticut 355,561 857,488 41.5
Delaware 96,374 200,152 48.2
Maryland 878,174 1,334,493 65.8
New York 1,862,445 4,314,280 43.2
Oklahoma 417,207 503,966 82.8
avg. = 55.4%
Pennsylvania 2,938,095
Kentucky 712,733
Oregon 943,163
South Dakota 149,244
Note that Oklahoma's turnout has distorted the average in the second table. There was a lot of room for Dems to improve enthusiasm for Dems in a place like Oklahoma, but but in much more Dem-friendly and Dem-stable mid-Atlantic states the range of Kerry turnout runs from 41-66%. Of course, one could argue the other closed primary states did not see contested general election races in 2004. None were battlegrounds (arguably Arizona slightly). Meanwhile, Pennsylvania was a 2004 battleground, meaning much more effort was put into building Kerry turnout there. If nothing else, that should cancel out the factor of more time focused on PA than the other states in the primary season.
Looking ahead to NC
SEMI-OPEN PRIMARIES
State 2008Turnout #RegD #RegI #DITot %TurnRegD %TurnRegDI
New Hampshire 205,040 258,556 356,023 614,579 79.30 33.36
California 5,066,978 6,749,406 3,043,164 9,792,570 75.07 51.74
Massachusetts 1,254,437 1,472,707 1,987,053 3,459,760 85.18 36.26
New Jersey 1,108,044 1,170,644 2,798,817 3,969,461 94.65 27.91
Utah 131,403 125,992 *1,040,000 1,165,992 104.29 11.27
*estimated
North Carolina as of Apr10: 2,577,894 1,221,182 3,799,076
West Virginia n/a yet
SEMI-OPEN PRIMARIES
State 2008 Turnout #KerryVotes %ofKerryTurnout
New Hampshire 205,040 340,511 60.22
California 5,066,978 6,745,485 75.12
Massachusetts 1,254,437 1,803,800 69.54
New Jersey 1,108,044 1,911,430 57.97
Utah 131,403 241,199 54.48
avg = 63.46%
North Carolina 1,525,849
West Virginia 326,541
The conclusion from the NC portion of this data is unclear. As a proportion of Registered Dems, NC would look likely to be very high, somewhere in the 1.8M-2M range. But in the D+I proportion, we'd look to around 1.3M-1.4M turnout. One of the problems is the wide disparity in the previous semi-open states' proportion between Ds and Is. New Jersey obviously has many more unaffiliated voters than registered Dems, whereas California is the reverse. NC has a proportion closer to California with Ds outnumbering Is/unaffiliateds roughly 2-to-1.
Clearly Massachusetts is as blue as California, yet the percentages of unaffiliateds in Massachusetts is much higher. I think the distinction is somewhat artificial, based on state by state quirks. For example, I always voted Dem but only recently had my party registration reflect Dem (was always unstated or independent).
My instinct tells me something like 40% of the eligibles will vote in NC. That feels about right. Voter registration is 3.8M and counting with a couple days and official tallies still to tabulate. I am going to expect roughly 1.5M-1.6M in NC for now, which means I am recanting my prediction in an earlier diary that NC will exceed PA.
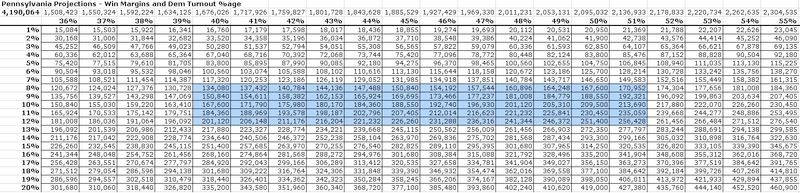
Finally, here's a range chart of PA turnout and popular vote margin. Sorry it's so small, here's a link to a well-sized googlesheets view:
Random Thoughts:
1. Jon Corzine was trying to create a Corzine Club like the Pelosi Club, but the media interpreted his gambit as possibly bailing on Clinton. Since he was trying to establish popular vote (and he is an absurd person who thinks 0 votes for Obama in Michigan is a legit result), as a justified principle for supers to rally around, I enjoyed the laughable failure of his effort. In his dismay that such a club was not established, he even wrote a blog at Huffington Post insisting he wasn't vacillating on Clinton.
2. The whole popular vote in the primary compared to the popular vote in the general is dishonest. New York has more Dems than Texas, yet Texas gets a million votes more say in who the Dem nominee is because it arbitrarily opens its primary to independents and Republicans? You cannot get this discrepancy in the general.
3. It's also dishonest because had popular vote been the rule, Obama would have spent far more than 1.5 days in California. Hell, none of the candidates would have campaigned in Iowa, they'd have all been in big states from the beginning of 2007 since only individual voters overall would matter, not delegates.
4. It's also dishonest because it assumes caucus states like Minnesota (which has 72 delegates) would have purposely taken 1/4 of the voice of Missouri (also 72 delegates) in determining the nominee by choosing the caucus method to dilute their voice into near-nothingness. Missouri had about 823,000 and Minnesota 214,000 turnout. In the general election, a vote equals a vote equals a vote because every person voting for president is voting for the same main candidates.
5. Sean Wilentz' ridiculous tripe is wonderfully obliterated by Jon Chait. The main point? Obama is winning the popular vote, yet Wilentz thinks it would be more "democratic" to change the system so that the person losing the popular vote is winning the delegates.
