Yesterday, I released an updated map of the Democratic primary and Seneca Doane pointed to this diary from March in which she (Seneca, please tell me if I guessed the right gender) advocates using white as a neutral color in place of purple for reasons of contrast: people are better able to distinguish between tints of a color than shade of purple. This is a fair criticism. Shades of purple are harder to distinguish than equivalently different tints of a single color.
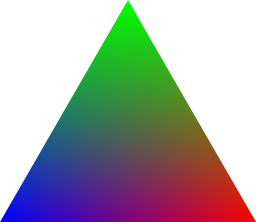
However, I do think that Seneca overstated the difference in her diary and I also think there are other trade-offs that don't make it a clear cut choice. In this diary, I am going to use a single color scheme for my primary map and that is that Obama is represented by the color blue, Clinton is represented by the color red and Edwards is represented by the color green.
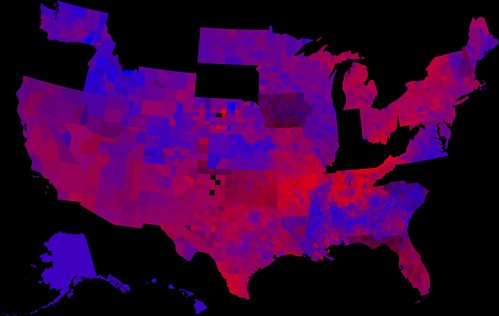
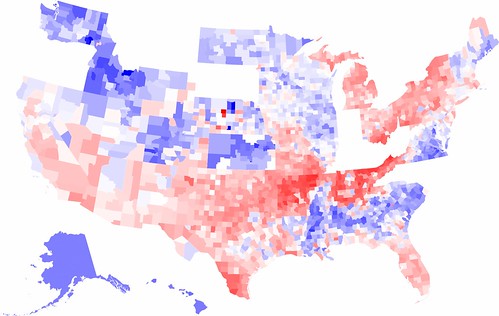
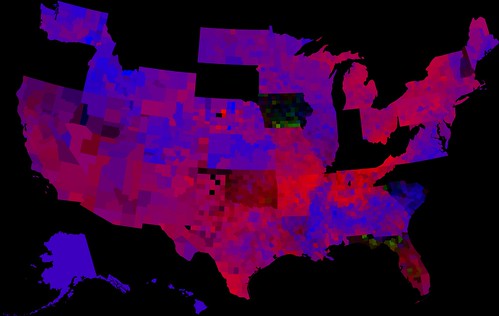
Here is my map of the primaries so far:
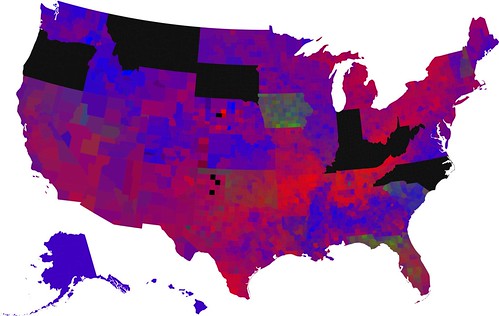
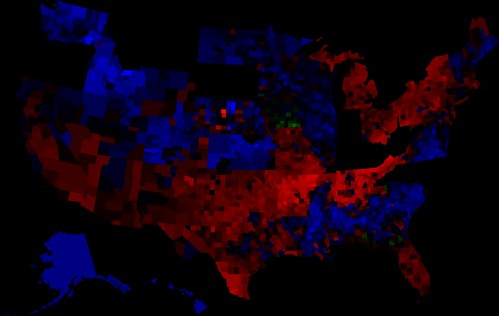
This is slightly different than the map I posted yesterday, in that Michigan is colored as if voters for "Uncommitted" were voters for Obama. Of course, Obama wasn't necessarily their favored candidate and there other issues with that vote and the vote in Florida that are not fixed by the recoloring. Here's the same map with a black background:
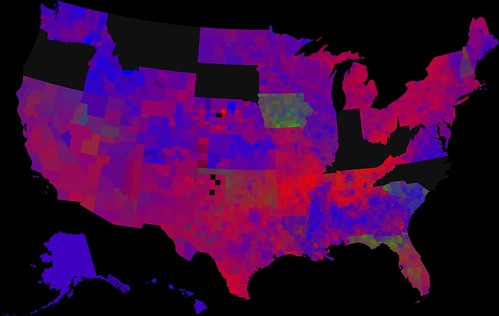
I personally prefer the black background, because it's easier on the eyes since the colors of the map are all at least twice as close to black as they are to white in brightness, though the white background map works better on Daily Kos.
This map is colored by the proportion of voters voting for each of the three main candidates. I will note, however, that this is not a ratio between the three. Counties where there were a significant number of votes for other candidates are darker than others.
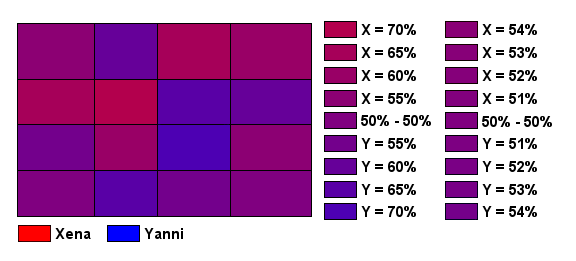
Now, back to the topic of using white as the "neutral" color and working instead with shades of blue and red (and green). In her diary from March, Seneca Doane created hypothetical state of Cartographia where there is an election between Xena and Yanni to illustrate the difference between using purple and using white. However, there are definite differences between how she sets the colors and how I would, so I created modified versions of the maps she made to reflect my coloring scheme as well as one that uses black as a neutral color.
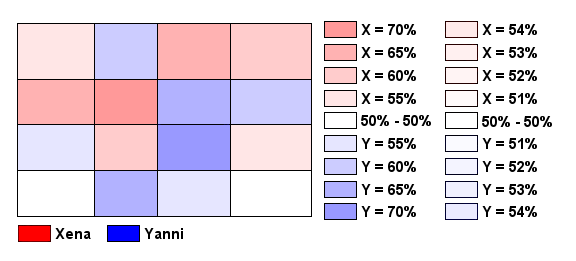
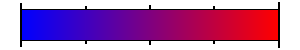
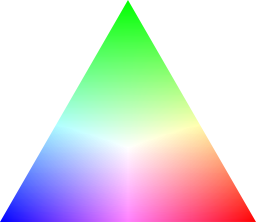
This is what a more polarized election would look like with my color scheme (colors are all from the left column of the legend):
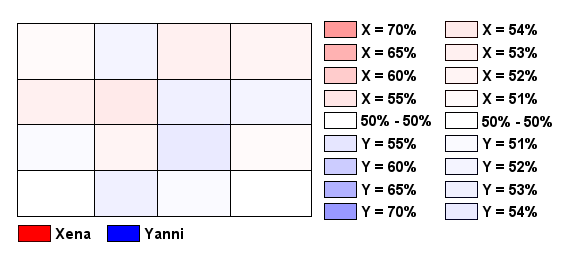
And here's a less polarized version (colors are all from the right column of the legend:
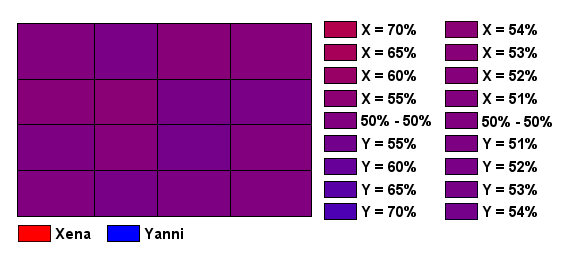
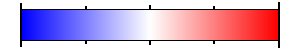
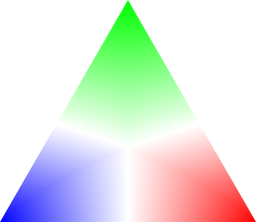
You can certainly make out the differences in the polarized election, but it takes a keener eye to spot them in the less polarized election. Now, here's the same two elections using white as a neutral color:
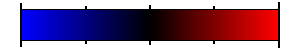
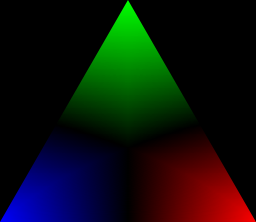
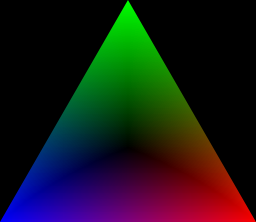
And for comparison, black as the neutral color:
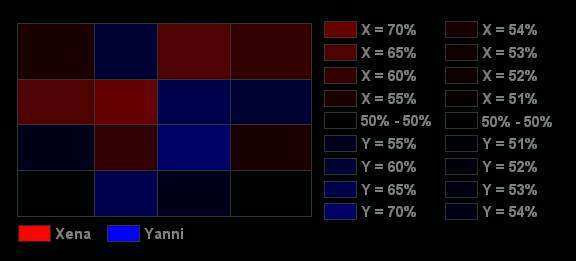
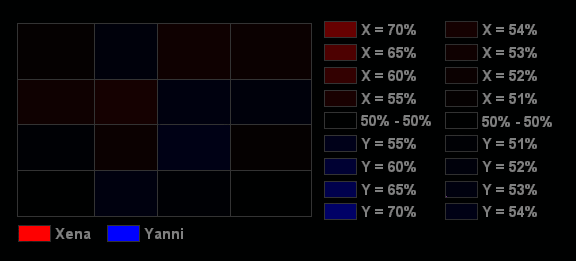
I agree with Seneca Doane that the white shows a more distinct contrast than the purple, but it also seems that the black is just about as effective as the white.
While this property is a strength in terms of contrast, it also serves as a weakness in terms of overall perspective. Here are the three linear scales representing the above color scheme's from X-100% Y-0% to X-0% Y-100%:
It's pretty clear which of the three is the most continuous. The increased contrast that comes from using a neutral color rather than a straight red-to-blue gradient creates an illusion that there is greater polarization than there actually is.
To apply this to the primary map, here's a version where the Edwards vote is cancelled out:
Note that while the below maps are purely maps of the margins of victory in each county between the two candidates, the above map is one of the vote proportions of each candidate.

It's quite clear that the lower two maps appear a great deal more polarized than the first map, and that comes from the fact that as maps of the margins of victories, they focus not on the total body of voters, but only those that represent the margin of victory between the first place and second place candidate, which gives nearly complete focus to the first place candidate in each county.
This brings us to another weakness of using white (or black) as a neutral color. Because this race started with not two but three viable candidates, the actual completely "neutral" color in the original map is gray, with purple being one of three "semi-neutral" colors (the other two being cyan and yellow). This arrangement would be a bit more clear if you were looking at the Republican map (I'm nowhere near finished with that), but Edwards did well enough to start to get the point across.
To start, with a third color, the map has a new scale:
There are now two ways that the scale could be change to accommodate a new neutral color. The first way would be to remove both the neutral (gray) and semi-neutral (purple, cyan, and yellow) colors, yielding these scales:
The problems with these new scales should be pretty clear. There is no visible difference between a county where Obama and Edwards tie, one where Obama and Clinton tie, one where Edwards and Clinton tie, and one where all three tie. The way to fix that would be to ignore the semi-neutral colors:
Note that the more neutral-looking color area for white and black have opposite orientation.
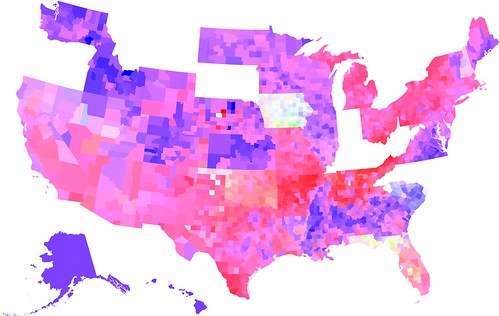
Now, for comparison, here, again, is the original map:
Here are the completely neutralized versions:

Here are the partially neutralized versions:
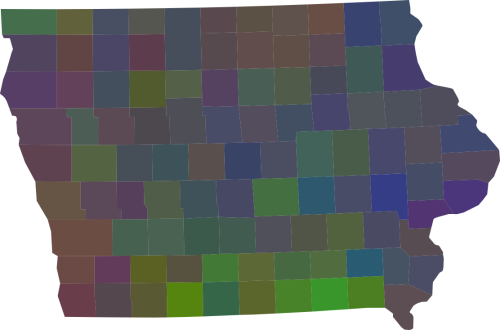
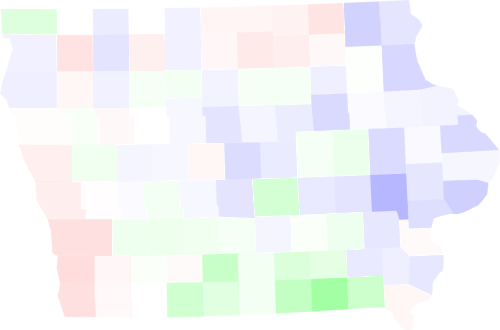
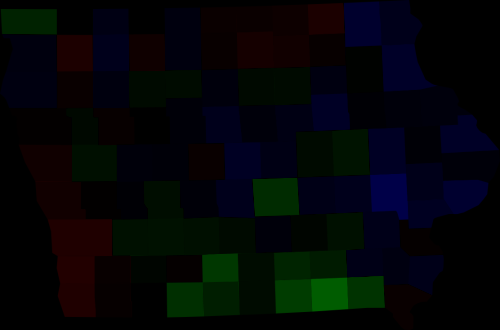
Now, while these last two maps look disastrous, it's worth comparing the methods again using just the state of Iowa, where the three candidates had the most even performance:
Here are the completely neutralized maps:
And here are the maps where only the gray has been removed:
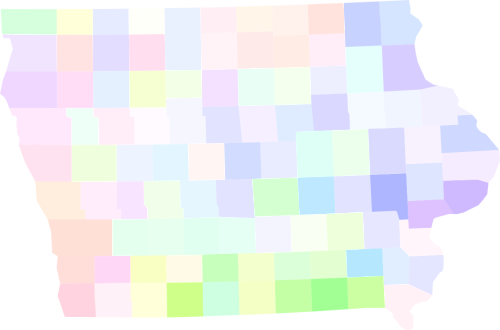
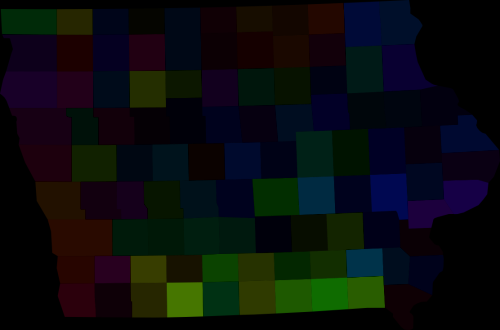
In this case, the maps with only gray removed are far superior to the completely neutralized maps. This is because there is quite a bit more information in them. The completely neutralized maps only show the margin between the first and second place candidates while the maps with gray removed show the margin between the first and third place candidates combined with the margin between the second and third place candidates.
So, basically, there are some trade-offs between different color schemes to represent the data. I personally prefer the proportional representation (purple map) over the marginal representation (white and black maps) because is offers the most accurate perspective of the entire contest, showing the trends of all voters, rather than the margins.
However, there is one more way to represent the results, and that is through monotone, single-candidate maps. Instead of subtracting the proportion of votes of one candidate from another, one can simply isolate each candidate's proportion of the vote separately, which shows things that would go unnoticed in every other type of map shown above.
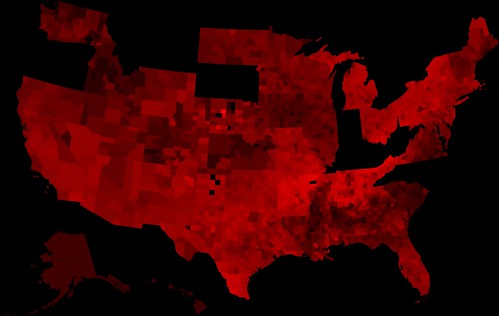
Here's a map of just Clinton's vote proportion:
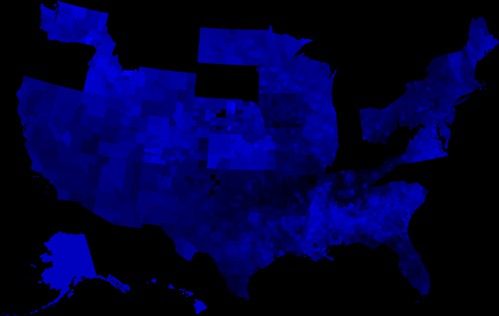
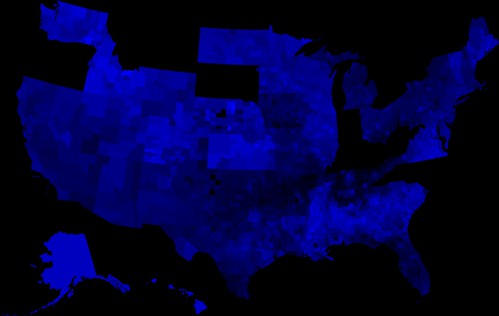
Here's a map of Obama's vote proportion and one with Michigan modified:
And here's just Edwards' portion of the vote: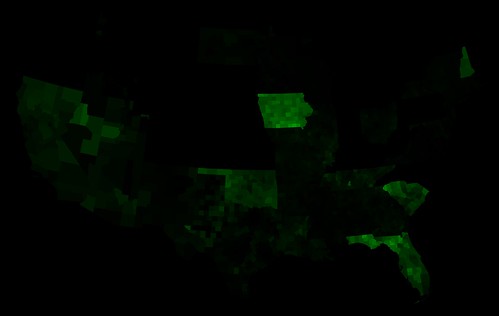
It may surprise you to see a significant vote for Edwards outside of the early states, but you can see that even in Texas in some of the (very) rural counties, Edwards won enough of the vote to affect the map.
Certainly, many more conclusions can be drawn from each of these maps and certainly, each type has it's strengths and weaknesses, and which map you use depends upon what aspects of the race you want to show.
