As promised, here are the maps from the Democratic primary. Like the commentary I did for the Republican race, this may be a little long and I apologize in advance for that. If you don't want to read everything, you can scroll through the maps and read the text near the ones you find interesting.
All the color maps here will follow this scale (with some caveats):

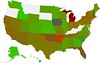
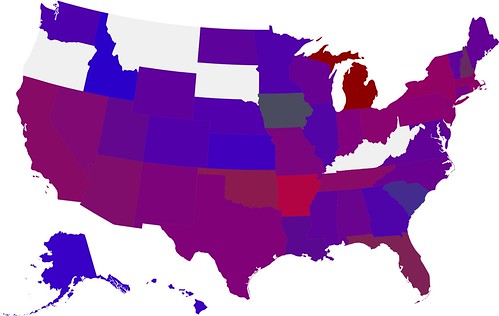
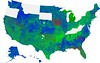
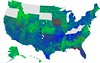
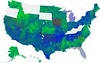
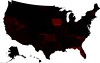
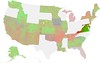
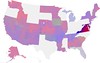
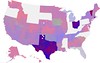
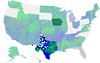
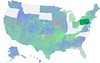
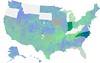
In the featured maps, red represents Clinton votes, green represents Edwards votes, and blue represents Obama votes. The caveat is that many counties are actually slightly darker than anything on this scale because of other votes (Biden, Richardson, Uncommitted, etc.).
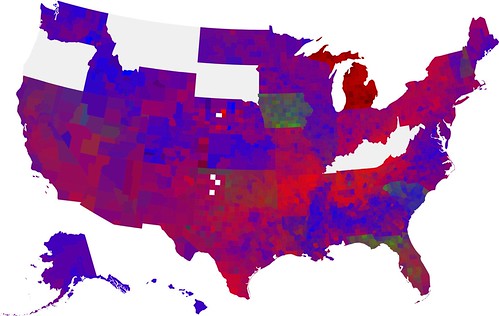
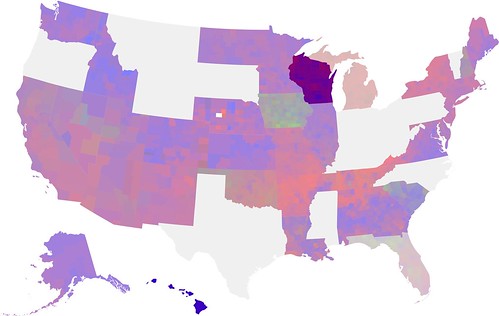
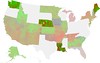
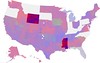
To start, here's the map of the primaries so far, updated to include Indiana and North Carolina:
[Update]: I updated the Iowa and Texas county conventions map and added color swaps for the modified original maps
Now, there are several common criticisms of this map. The first is that it treats th Florida and Michigan primaries as if they were normal legitimate contests and that the map I use not only doesn't reflect that, but gives the false impression that Michigan was unanimously for Clinton, since every county is a shade of red, since the other two candidates were not on the ballot (Clinton, Dodd, Kucinich, Gravel, and Uncommitted were the only ones that were).
This is a fair criticism, but there is no perfect way to represent the situation. I chose the above representation since it reflects the data, and I find that the strange coloration of Michigan with respect to the surrounding states actually accentuates the strangeness of the contest. However, for those who think otherwise, I've made two modified versions.
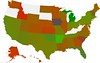
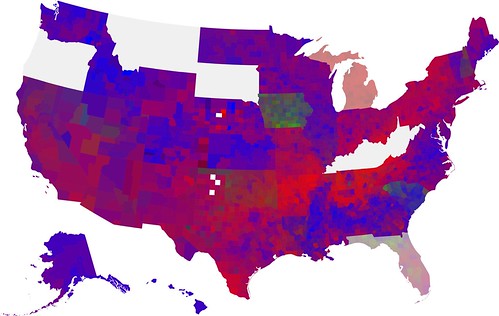
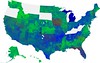
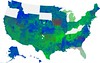
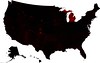
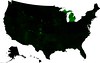
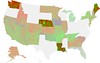
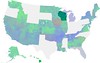
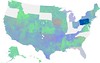
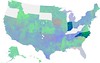
The first just addresses Michigan's coloration. I've treated Michigan's Uncommitted votes as if they were votes for Obama:

Though not obvious at this size (I would suggest looking at the large size on Flickr to see this), even with this modification, border counties in Michigan are all significantly redder than counties on the other side of border. This is especially obvious with Wisconsin, but it is also true with Indiana and Ohio. I suspect if Michigan had held a legitimate contest, Obama would have won.
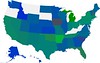
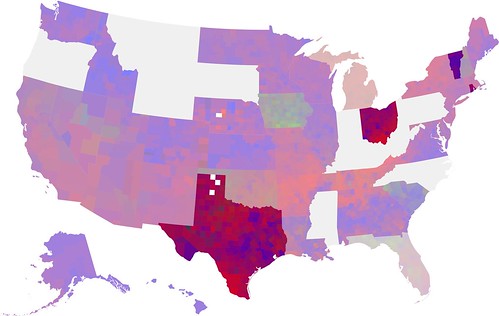
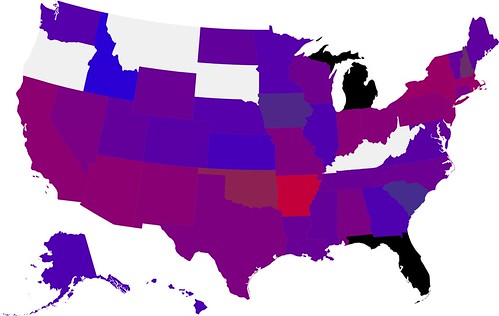
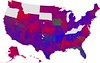
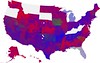
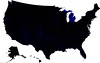
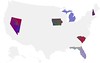
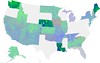
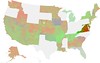
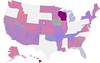
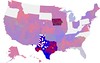
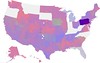
The second is one that is meant to address the legitimacy issue. I've dimmed the states of Michigan and Florida so that you can see some of the trends if you look closely, but it is pretty clear that they don't fit in with the rest:
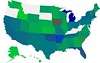
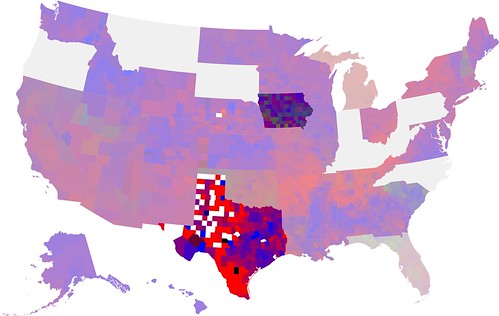
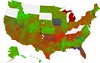
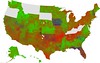
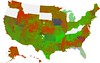
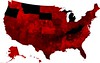
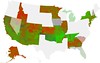
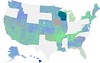
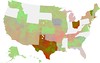
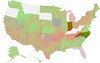
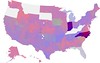
A second criticism, and one that I have not yet addressed in the form of an adjusted map, is that it treats all counties as equals in terms of voter density, which is nowhere near reality. Earlier, I did make a map weighted by Kerry voter density, which is represented by this map (brightness is determined on a logarithmic scale):
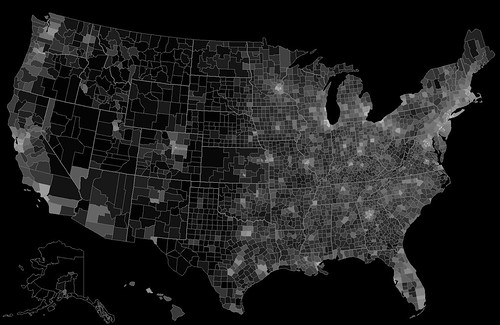
As you can see, not all counties are created equal, and so, the maps here have a fatal flaw in misrepresenting the actual vote ratio. Missouri is a good demonstration of this, where the vast majority of counties and as a result, the vast majority of the land area leans significantly toward Clinton, but Obama narrowly won the state, because of his superior performance in the urban areas.
So, in many areas, Obama's performance looks weaker in my maps than it is, though many of the western states where Obama had strong performance actually have very few people (and even fewer Democrats), so in some ways, it biases toward Clinton, while in others, it biases toward Obama. On a side note, my Kerry density map is biased against Alaska, which has a land area that is much greater than any other state.
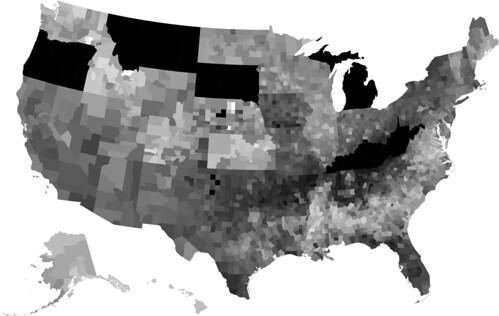
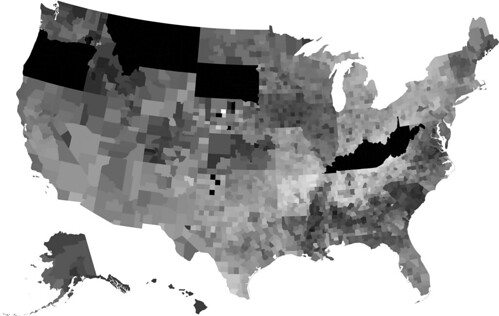
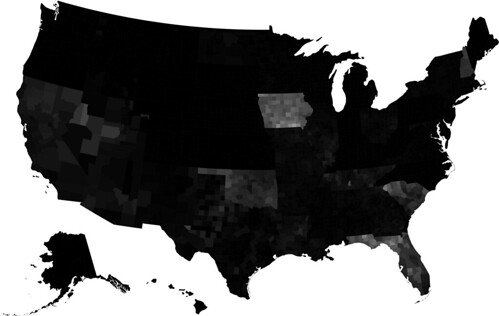
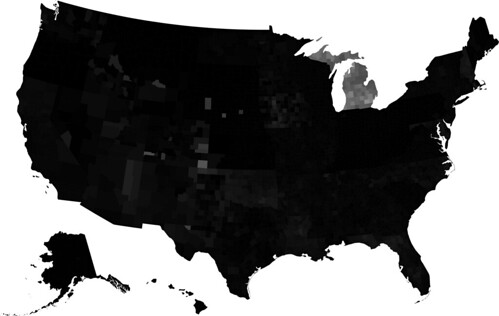
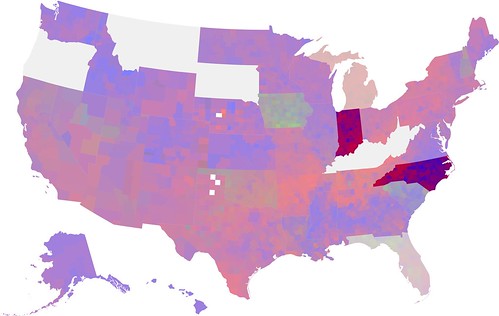
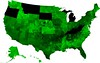
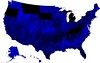
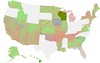
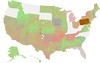
Now, as well as colored maps, I have some one-candidate maps that show that candidate's vote ratio by county:
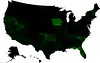
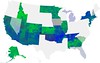
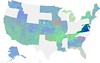
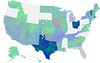
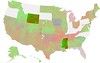
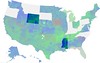
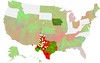
Obama
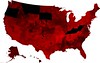
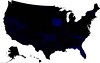
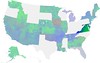
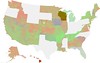
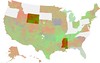
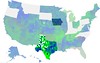
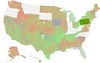
Clinton
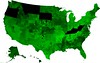
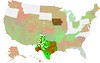
Edwards
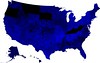
Other
Now, I do want to make a few points from these maps, where the contrast is most clear. The first is that Clinton actually did quite well in North Carolina. If you compare North Carolina to the surrounding states in the Obama map, you will see that Obama drew a comparatively lower proportion of the vote (I suggest the Obama map because of the confounding factor of the Edwards vote in South Carolina, which took away mainly from what became Clinton's voting base in subsequent contests). However, part of this may be not that Clinton did well in North Carolina, but that Obama did well in Virginia, which I'll get to later.
On the other hand, Indiana looks just like western Ohio, which suggests that her performance there was actually weaker than in North Carolina in the sense that she only did as well as she did in similar contests earlier and not better, as she did in North Carolina. Of course, one could point out that there is a dramatic shift at the Indiana-Illinois border, but it's not much different than the shift at the Missouri-Illinois border, two contests that were held on the same day.
Which brings me to a point about momentum. Though in the Democratic presidential primary process, momentum was much less a factor than in the Republican primary process (and there are good reasons for this), it does present itself and it probably will again in the next couple of contests.
But without further adieu, here is the course of the Democratic presidential primary so far
Early states
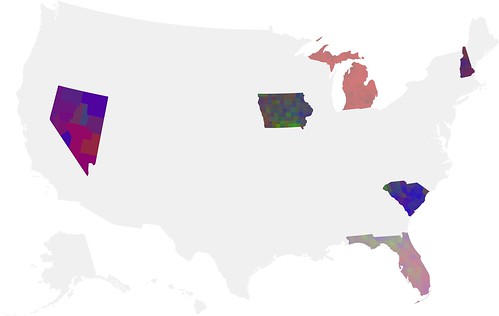
Unlike the Republican race, Iowa played a pivotal role. Part of the reason for this was that Iowa was universally agreed to be the first round by the candidates and every candidate devoted significant time and resourses to the state. Furthermore, the Democratic caucus process with its viability rules is much more effective at eliminating fringe candidates and narrowing the field to a more manageable set (which is IMO, and perhaps counterintuitively, important in keeping a SMDP election democratic...but I won't go into that here).
In a result that shocked the national (read NYC and DC-based) media, but not me, a participant in the process, Obama took first place to a distant second by Edwards and a close third by Clinton (I was more surprised that Edwards didn't take a closer second than that Clinton took third). Richardson took a distant fourth, with Biden and Dodd, the fifth and seventh place candidates (Uncommitted was sixth) dropping out.
This led into a New Hampshire contest which had been tipped as a Clinton firewall until the polls started predicting an Obama landslide. A clip of Clinton getting moist-eyed and talking about the difficulties of the race (before going into a thinly veiled attack on Obama) was widely circulated by the press and Clinton went on to win New Hampshire by a small margin, but since the win was unexpected, the media billed it as a come back. Richardson drops out, leaving the three candidates relevant to these maps, Kucinich, and Gravel.
Michigan held its illegitimate primary, where Clinton pulled only 55% of the vote against Uncommitted, Kucinich, Dodd, and Gravel. The information that the media considered relevant was that exit polls showed that African-Americans voted overwhelmingly Uncommitted, playing into a narrative that would peak just before South Carolina
Clinton went on to win the most delegates in the Nevada caucuses, riding on strong Latino support, especially in Clark county. However, because of the weighting of delegates in the Nevada delegate selection process, the Obama campaign was able to claim a projected delegate win, starting the "delegates vs. votes" narrative, a shift from earlier attitudes from the two campaigns.
South Carolina was, of course, billed as Obama's comeback, where he won 55% of the vote, being the first candidate to win a majority in a legitimate contest. It was a contest overshadowed by the issue of race, footnoted by the chants of "Race doesn't matter!" before Obama's victory speech and Bill Clinton's now infamous mention of Jesse Jackson's South Carolina wins to the press.
Florida held its illegitimate contest, in which Clinton won half the vote over Obama and Edwards, though none of the candidates had campaigned there. Clinton flies to Florida for a victory speech that night. Edwards suspended his campaign in New Orleans the next day.
February 5
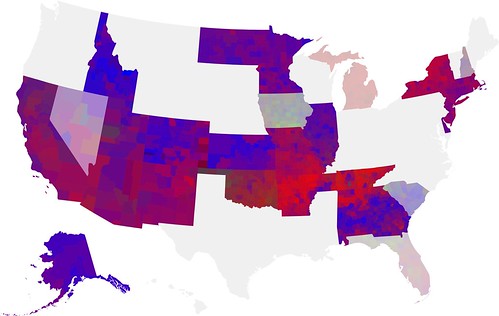
Also called Super Tuesday and Tsunami Tuesday, February 5 was the earliest date that both parties allowed non-exempted states (Iowa, New Hampshire, Nevada, and South Carolina in the case of the Democrats) to hold their contests, and it became the single biggest day in terms of delegates in the entire primary contest.
Clinton did well in many of the states that were billed by the media as "pivotal" such as California and New Jersey, while losing smaller states such as Idaho and Kansas in landslides. Obama did better than expected in Georgia and Alabama as well as Connecticut and Delaware.
At the end of the night, the media and the Clinton campaign were bewildered a much closer race than they had expected, with the race continuing as only the Obama campaign had predicted. This foresight had an effect on future contests. However, foresight wasn't the only advantage the Obama campaign had. A favorable schedule was arguably an even bigger factor.
February 9 and 10
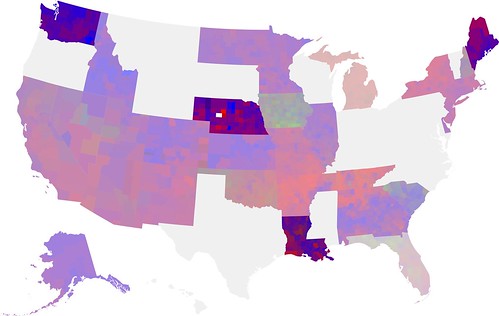
The first part of this favorable schedule was February 9, when caucuses in Washington and Nebraska as well as the Louisiana primary were held. All three states were won by Obama by wide margins.
The Obama campaign's foresight really kicked in in the Maine caucus the next day. The Obama campaign had spent more time preparing and more resources organizing their campaign their, two very important factors in caucus states and this approach also served him well on February 5. Obama takes Maine to the surprise of some in the media and also counter to their leaked delegate predictions spreadsheet.
Potomac primaries
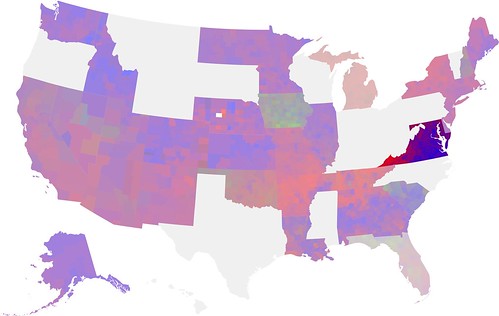
Now with a very strong cash advantage as well as a demographic advantage in the Potomac primaries (Maryland, District of Columbia, and Virginia), Obama again wins by wide margins, again outpacing his own campaign's predictions.
February 19
Obama's streak continues with the Wisconsin primary and the Hawaii caucus. The resource advantage of the Obama campaign at this point (which is the real basis of "momentum") is overwhelming and the results show in Wisconsin which doesn't show as much of a difference from Illinois at the border as did Missouri on February 5 or as Indiana would on May 6.
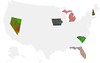
March 4
In terms of winning the overall contest March 4 was an overwhelming loss for Hillary Clinton, despite being the first day where she actually had a net gain in delegates. The Clinton campaign had taken to the Giuliani-like strategy of focusing resources on later contests (Ohio and Texas) with more delegates and preferable demographics while allowing her opponent to run up his delegate count in smaller states, a strategy that was foolish in the Republican contest and one that was foolish in the Democratic contest. Vermont shows a strong Obama vote, with every county going for Obama, the end of a long streak of wins.
The primaries in Rhode Island, Ohio, and Texas, however, go to Clinton, but by narrower margins than would have been expected before Obama's winning streak. To me, this marked the beginning of the end for the Clinton campaign, though it did give her an infusion of cash to continue running as well as a psychological victory, which would have an effect that would later play into her relatively good performance in North Carolina.
Wyoming and Mississippi

Clintons's narrow wins in some big states were followed up by two landslides for Obama in small states. The victories in Wyoming on March 8 and Mississippi on March 11 helped the Obama campaign dampen Clinton's psychological victory from March 4.
Iowa and Texas County Conventions
The good news for the Obama campaign continued with the Iowa County Conventions on March 16, which turned Obama's narrow projected delegate plurality into a clear projected delegate majority because of the crossing over of a large portion of the Edwards delegates joining Obama preference groups at the conventions.
Then on March 29, Texas held it's county conventions, which confirmed that Obama had won the precinct conventions on March 4 and gave Obama a projected delegate win in Texas.
Pennsylvania

With another large, demographically favorable state, Clinton was able to pull off another large psychological victory and money haul with a 9 point win in Pennsylvania.
Since, beyond the county conventions in Iowa and Texas, which weren't major headline grabbers, no contests were held between Mississippi and Pennsylvania, the media began to focus their campaign coverage on the more inane matters of the races. This is when we saw Rev. Wright, Tuzla, bowling, and "elitism". It was topped off with a shameful debate hosted by Charles Gibson and George Stephanopolous of ABC.
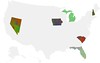
May 6
Finally, the May 6 contests. The narrow Clinton win in Indiana and the strong Obama win in North Carolina forced the media to switch its narrative to something similar to its narrative with respect to the Republican race when Romney dropped out: that the nomination was essentially Obama's (McCain's) but Clinton (Huckabee) was going to stay in the race in a quixotic quest for an unobtainable nomination.
Looking at the trends, one can get a pretty clear preview of the next few contests. Barring Senator Clinton's withdrawal from the race, West Virginia and Kentucky be victories for her and Oregon will be an Obama victory. Puerto Rico isn't on the map, but South Dakota and Montana will also go for Obama.
Finally, like the Republican race, I'm going to comment on the Democratic apportionment of delegates. The Democratic pledged delegate system is much more representative of the actual will of the participants in the process than the Republican system
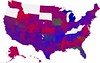
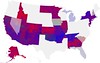
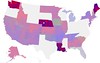
Here is a map of the vote ratios by state:
Compare to the pledged delegate ratios, again courtesy of The Green Papers:
I think it should be pretty clear when comparing to the Republican apportionments (near the bottom), that the Democratic method is more representative (ignoring the confounding factor of the superdelegates), though it certainly has not helped us to a quick end to this process.
Color swaps
Modified Michigan map


Dimmed Michigan and Florida map

Obama
Clinton
Edwards
Other
Early states


February 5


February 9-10

Potomac primaries
February 19
March 4


Wyoming and Mississippi

Iowa and Texas county conventions
Pennsylvania
May 6

State map