With the ink nearly dry on the presidential nominating process, the time has come to begin focusing on the general election. To that end, for several months now I have been periodically checking on the election pools over at Intrade.com.
I put together an analysis of the presidential race as seen through the eyes of the Intrade investment community. It is quite revealing and includes a few surprises in it's scope. If this proves of interest here (by way of recommendations) I'll update this weekly or so as we run through the process.
For those who are not familiar, Intrade is an investment organization that specializes in trading on the outcomes of various political events. These primarily take the form of "investing" (or betting if you like) on elective races.
These sorts of election markets have earned a reputation of remarkable accuracy in predicting the outcomes of elective races and political processes. These markets consist of large numbers of individual investors, people not generally given to flights of fancy, idealism, or buying in to spin. Their livelihoods depend on the cold hard realities of the open market.
They can't afford to be swayed by hyperbole, tortured reasoning, or rationalized justifications for supporting one candidate or another. Indeed often they may not even be supporting the candidate they are betting on. They are just using their judgement to make a pragmatic decision designed to generate a return on a financial investment.
So I decided to have a look-see into what's been cooking over at Intrade. In addition to their primary race markets and a variety of other investments, they are currently offering a series of investments based on the expected results in the general election. Just a straight head to head Dem vs Rep predictive matchup in each and every state.
I've compiled a list of all 50 states along with the Intrade latest trade price for Democrats and Republicans for each state. The higher that price, the stronger the collective opinion of the investors about which party will win the state.
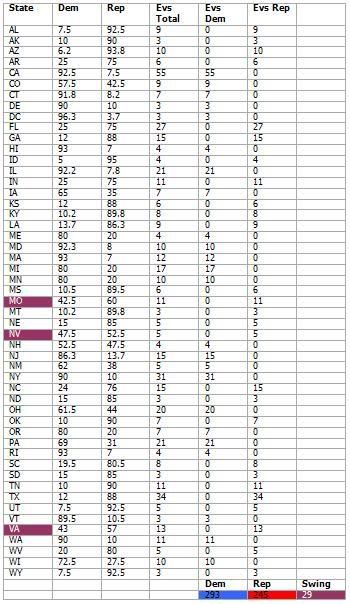
The list also shows the number of Total Electoral votes for each state and the number of EVs projected for each party for that state. Since no state splits EVs i.e. every state is winner-take-all, each state will show the same number in the Dem or Rep side as it does in the total EVs side.
There are a handful of states where the margin of difference is under 15%. I've called these our swing states. Right away it's clear that we are dealing with an entirely different set of swing states than what we are traditionally used to.
Several states which have recently been trending purple based on polling (such as Colorado and New Mexico) or have been considered swing states in the past (such as Ohio and Pennsylvania) are looking like strong democratic contenders right now.
At the bottom we have our totals, including a column for swing states. In all cases, the only states where margin is under 15% are trending republican according to the intrade pricing. Now that may sound like bad news to some, but here's the thing. It means that there is not one swing state that is likely to shift away from democrats. Any shifting that is likely to occur would be away from republicans.
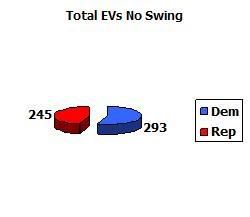
But wait, it get's better. Check out this electoral map, if the electoral college were to fall the way the investors predict, we would have a democratic win of about 8.9 percent.
EV Map No Swings

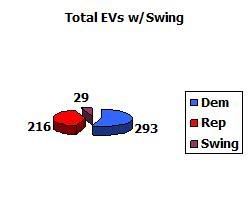
Now let's take a look at our swing states.
EV Map with Swings
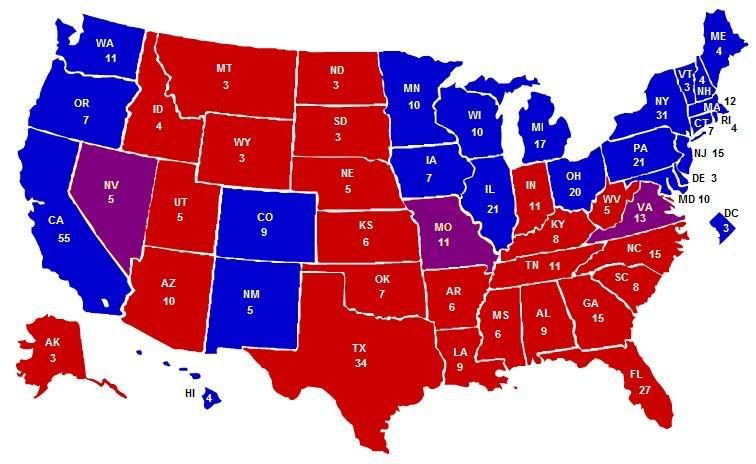
Nevada, Missouri, and Virginia. Can you imagine that?!! Virginia a swing state? Who would'a thunk it? If even one of those swing states should actually swing, we are looking at a democratic landslide.
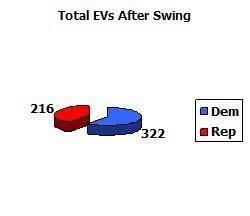
And if all of them should swing, we are talking about a landslide of epic proportions. Well over 300 electoral votes. That means a big time mandate and long democratic coattails!
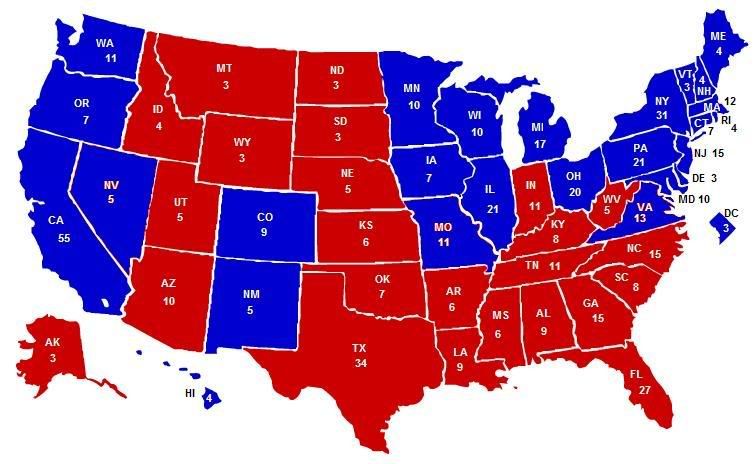
Just look at the EV distribution if all those states should actually swing.
We can argue over polls all day, but the way I see it, it's one thing for a pollster to run over his spreadsheets and make a prediction when he's got nothing riding on it, but it's quite another when an investor puts money on it. Their livelihood could be at stake. They can't afford mistakes, so they use the best statistical models the financial industry has to offer to make those decisions.
I'm not saying this is proof of anything, but I think it's worth taking a gander at now and then. If the analysis seems interesting and worthwhile, please give a rec to the diary so I can know there's enough interest for me to continue tracking this fascinating analysis based on a view of the process from the standpoint of the market investors.
Update 1 by MaverickModerate 2:25PM MST
A few people have pointed out that there are a couple states that do indeed split EVs, I'll fix that in the next analysis.
Also thanks to unertl for pointing out that New Hampshire falls within the 15% swing threshold. I'll correct that next time as well.
