The criticism that the phrase "jobless recovery" is a contradiction in terms has a lot of merit, as was recently written by Paul Krugman, who said on his blog, "the fact that the economy may be technically in recovery is irrelevant" to the vast majority of Americans, for whom the most important metrics by far are jobs and wages, not simply whether there is an economic Expansion.
Responding to this concern, I recently researched 4 statistics that have proven to be specific harbingers of job growth, and published a six-part series on the subject, "When will the economy start to add jobs?" at the Bonddad blog last month. That research led me to conclude that it was most probable that the jobs market would bottom and start to add jobs in November or December, +/- 1 month. And it's not just me. Within the past week Prof. Krugman has acknowledged that if present trends continue, "we should be seeing some job gains soon," and Prof. James Hamilton of UCSD has agreed that "[recent] growth is inconsistent with a jobless recovery."
Below I summarize the historical record of 4 Leading Indicators specifically for job growth, and what they show now.
Although I first noted "The Case for a V Shaped Jobs Recovery" back in July, to much skepticism, the robust recent growth in manufaturing and exports in particular has caused some prominent economists, as noted above, to reconsider their previous positions.
There are at least 4 "Leading Indicators" which in the past have specifically portended job growth. They are listed in here in the chronological order in which they have historically signaled:
(1) Real retail sales bottom and turn.
(2) Initial Jobless claims turn.
(3) The ISM manufacturing index turns above 50, i.e., signals actual growth.
(4) Industrial Production turns.
(5) ISM manufacturing index is above 53, ISM employment is at (- 5) or above, initial jobless claims are at least a sustained 16% - 20% off peak, and both Industrial Production and Real retail sales have advanced at a rate of 2.5% or more year-over-year from the bottom.
By September, (1) through (4) had already happened. Number (5) is all about the strength of the turns. ISM Manufacturing and Real Retail were already on the cusp of their final signals, and Industrial Production was growing, but not quite enough yet. Initial Jobless Claims were still only 15% or so off peak, dropping so slowly that it would take at least 3 more months at that rate to signal job growth.
Based on those relationships, last month I concluded that payrolls would most likely hit bottom and turn around in November or December, +/- 1 month.While November looks unlikely as a bottom for jobs, December may still prove to be the turnaround month.
Here's a summary of my discussions of each of the above indicators, and why they suggest this Expansion may not be a "Jobless Recovery" much longer.
I. Real Retail Sales
Contrary to the commonly held belief, historically it has not been the case that job growth leads to consumption. Rather, it is the other way around. Consumer spending typically leads jobs with a lag of about 5 months. Here is a graph showing that point as an average of all post-World War 2 recessions (0 = the month a recession ends):
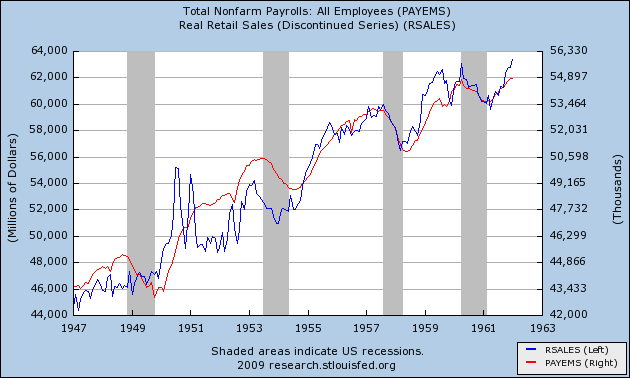
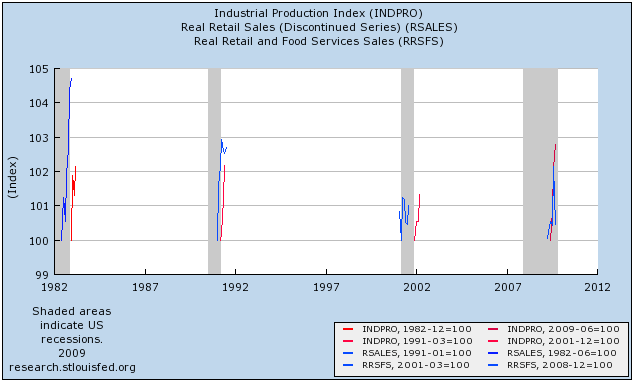
Real retail sales (that is, retail sales adjusted for inflation) are the "Holy Grail" of Leading Indicators for job growth. They have consistently turned at both tops and bottoms, an average of 3-5 months before job growth or losses turned. When real retail sales stay flat, they generate a lot of noise, and a longer period between the turn in sales and payrolls. Strong turns in sales generate reliable subsequent moves in payrolls in subsequent months. In general, with regard to recoveries, an increase of about +2.5% a year is necessary to reliably generate a subsequent move in real retail sales. In order to show you this relationship in the most comprehensive way, I am reproducing here graphs showing the entire 60 year record of real retail sales compared with jobs. With the sole exception of the 1961 recession, Real retail sales (the blue line) has consistently made peaks and troughs ahead of payrolls (the red line) ...
in the postwar period from 1948 through the 1962:
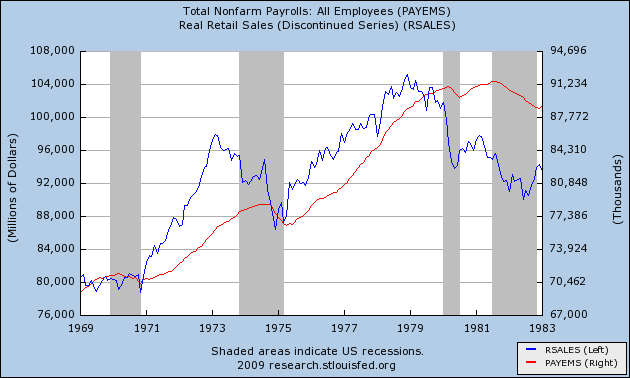
as it did during the 1970s recessions (ex the 1970 trough):
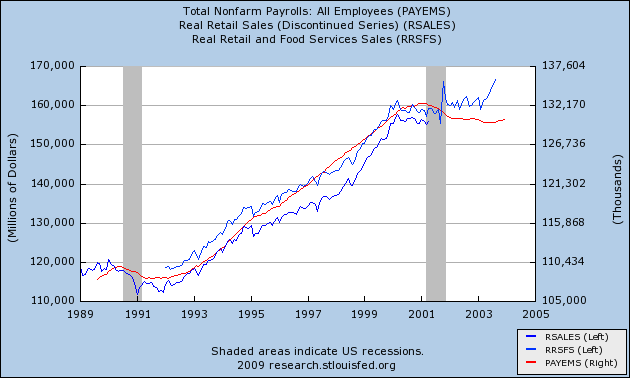
as it did during the 1991 and 2001 recessions and "jobless recoveries":
as it has done now:
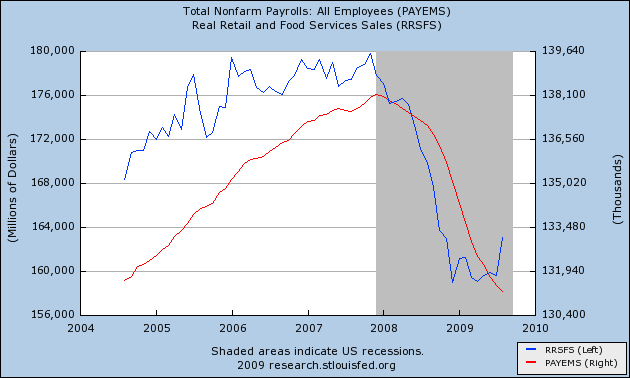
Because of the unique nature of "cash-for-clunkers", it is difficult to read the last couple of months of this indicator. On a three month smoothed average, it bottomed in April of this year, and on that basis, Real retail sales are still up only about 0.9% off that low. That's not consistent with adding jobs yet. I will discuss this indicator again, in conjunction with Industrial Production in part IV below.
II. Initial Jobless Claims
Initial jobless claims is weekly number of people who have applied for unemployment benefits for the first time after being laid off. these jobless claims have a good track record of predicting job gains. In those recoveries where jobless claims have fallen steeply, peak unemployment occurred within 2 months of the point where jobless claims fell 12% from the peak; but in those "jobless recoveries" where jobless claims has fallen slowly, peak unemployment occurred not at the 12% mark, but only when new jobless claims were more than 16% less than peak claims, and stayed more than 16% off for at least 3 months thereafter.
In our recession/expansion, initial jobless claims have fallen slowly since the beginning of April. A month ago, initial claims were still less than 16% off their highs. That all changed in the last four weeks. Jobless claims have fallen substantially, and now the 4 week moving average stands at 531,500, almost 20% off the peak of 658,750, 6 1/2 months ago.
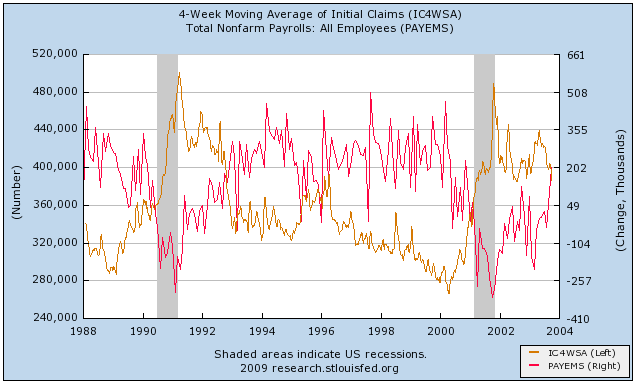
Here is a graph comparing this recession with the two previous "jobless recoveries" and the V shaped deep recession of 1982 in terms of initial jobless claims:
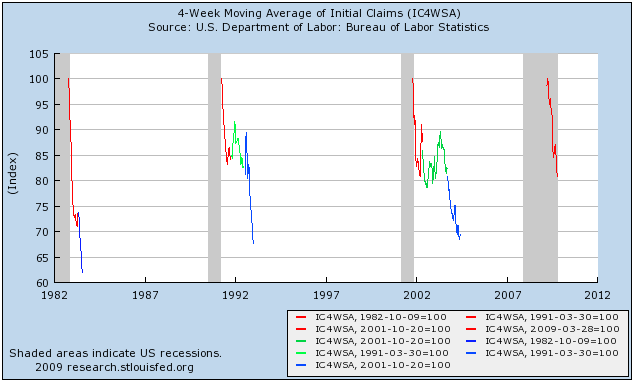 <div>In the graph above, the red lines represent the first 6 1/2 months off the peak of claims. As you can see, our recession/recovery is more comparable to the last two than to the 1982-3 recovery. The green lines represent the continuation of the "jobless recoveries" until the point where both jobs and the unemployment rate had bottomed. As you can see, jobless claims failed to penetrate the 20% off level except for a brief instance in summer 2002 (coinciding with a brief positive jobs number). There is no green line for 1983, because in that recovery payrolls immediately improved. The blue lines show how jobless claims dropped after both payrolls and unemployment reached their nadir.
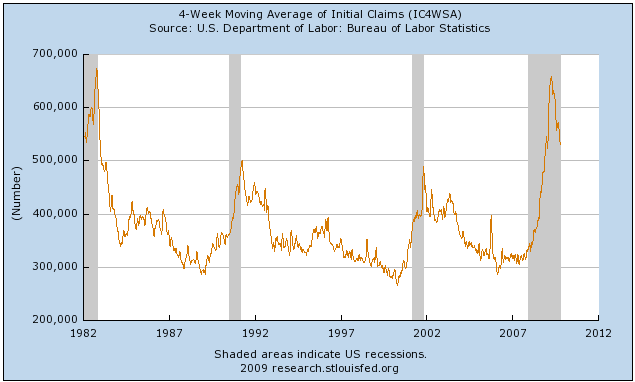
To remind you that the 1991 and 2001 recessions were very shallow compared with 1982 and the present, here is the actual number of claims from 1980-present:
III. ISM Manufacturing
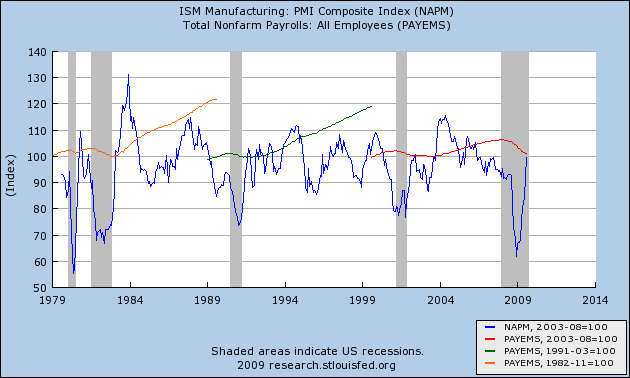
The ISM Manufacturing Index is a survey which asks purchasing managers for manufacturers if their business is getting better or worse, and contains a sub-index in which business indicate their hiring or firing intentions for the next month. It is a "diffusion index" in which 50 is the dividing line between expansion and contraction. In the very strong recovery after 1982, as well as during the weak recoveries of 1992 and 2002, the 53 level is the point where jobs began to be added in. Further, a reading over 54 on the index has always coincided with actual job growth.
Additionally, whenever the hiring vs. firing sub-index is (- 5) or higher (i.e., no more than 5% more employers plan to fire than hire) and rising, where other evidence indicates a recession is ending, that has always indicated net employment growth was imminent, at least on a temproary basis; and also, whenever current staffing intentions were 65+. and hiring plans were 15+, that has always coincided with positive jobs numbers in the BLS survey, including during and after the "jobless recoveries" of 1992 and 2002.
The ISM manufacturing index stalled out at 52.6 in September, thus the graph looks the same as last month. (in the graph, the ISM reading of 53 - in blue - is normed to 100. The red, orange, and green lines represent job growth/losses in the noted recessions and recoveries):
IV. Industrial Production
Industrial production means exactly what it sounds like it does. It tends to peak a median +2 months before payrolls, and to trough at the end of recessions a median +1 month before payrolls. Of the 10 troughs since World War 2, in 8 of them industrial production troughed within 2 months of the payrolls number. Further, the only times that industrial production has led employment growth by a relatively long period of time, it has also shown weak growth -- less than 5% a year. In more typical V shaped job recoveries, it has grown at a rate of 10% or more a year.
Remember I told your I would return to Real retail sales? Here is a graph, showing the moves of both Industrial Production, which bottomed 3 months ago (in red), and Real Retail Sales, which bottomed 7 months ago (in blue), 3 and 7 months respectively from their lows in the last three recessions as well as currently:
Remember that historically both of these statistics have had to be up 2.5% or more from their bottoms for job growth to occur. As you can see, because of Industrial production's continued strong growth in September, it is now up almost 3% in only 3 months -- in excess of the 10% annualized growth correlated with job growth. Industrial production is indeed having a "V" shaped recovery, growing even more than in 1983. By contrast, the expiration of cash-for-clunkers returned Real retail sales to very anemic growth similar to its pattern in the last "jobless recovery," below the 3% annual growth typically associated with job growth. Because of the unique contribution of car sales to this statistic, it is probably more appropriate to average the last two months. Until we see what happens to car sales in October, the jury is out on this number.
V. Summary of the Leading Indicators for Job Growth in the last month
In summary, one indicator (the "holy Grail") Real retail sales, declined, but for unique reasons. One, ISM manufacturing, stalled. But two -- Initial Jobless Claims and Industrial Production -- are now at the levels they simply need to maintain for jobs to be added. Should the October Empire State survey of manufacturing (which showed strong growth) be a harbinger, in October ISM manufacturing will join them. That would make 3 of 4 indictors signaling imminent job growth. Real retail sales, which may improve with renewed car sales, is the laggard.
VI. How does the poor September Payrolls number fit in?
My painstaking analysis immediately got a good kick in the chops by the September jobs number, a more-than-expected decline of -263,000. But there are many paths to the point where a net +1 job is generated. Monthly nonfarm payrolls is a very noisy series compared with the 4 week moving average of initial jobless claims. Here's a graph demonstrating that point, using the two previous recessions and recoveries:
Sooner or later, however, the payrolls data and the jobs data always resolve in the same direction -- which for jobless claims has been continued improvement ever since April:
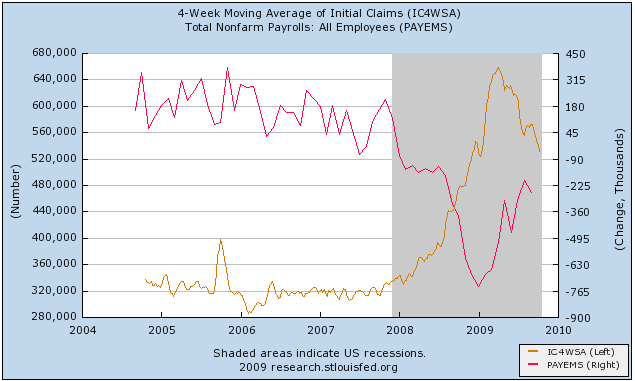
In other words, the September jobs setback could prove to be (painful) noise hiding an improving signal.
Additionally, I have previously shown in a discussion of "Okun's law" that over the last decade or more it has taken 2% YoY growth in GDP for even 1 net job to be added. Here's the relevant graph demonstrating that relationship (with YoY GDP growth shown in green, payrolls in red):
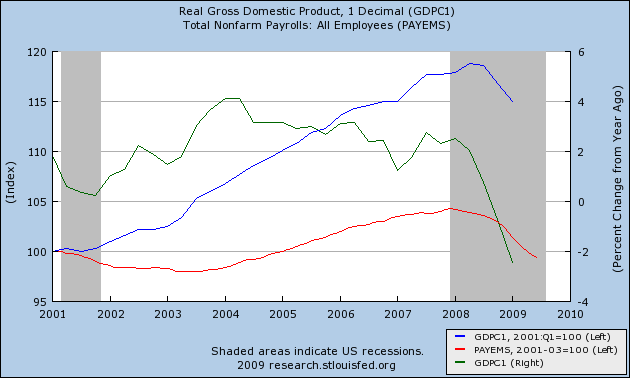
To reach 2%+ GDP growth by the end of this year, GDP must grow about 4.4% in the 3rd and 4th quarter combined. 3rd quarter GDP will be reported next week.
Because of this recent strong growth, Prof. Krugman now suspects that "recent industrial growth suggests GDP growth of 4 percent or more. If that’s right, and it continues, we should be seeing some job gains soon." Yesterday he was seconded by UCSD Prof. James Hamilton of Econbrowser who said, "That kind of growth is inconsistent with a jobless recovery."
VII. Conclusion
In short, despite the setback of September payrolls and sideways real retail sales, December may yet be the turning point after which the economy will actually add jobs. Much depends on how real retail sales develop. At the same time, as I said in my concluding installment at the Bonddad blog last month: let me be the first to acknowledge that this is not a scientific truth or certainty, but a best estimate based on a logical review of existing data with a long history that accommodates both traditional and "jobless" recoveries.
Finally, even if the economy starts to add jobs in the next few months, that doesn't mean the unemployment rate will be coming down quickly. And we have about 8 million jobs to add, simply to get back to where we were in 2007. That looks like a long time a-coming.
