Accelerated glacial melting will cause sea levels to rise 1.4 meters - 4.6 feet - by 2100, a much greater rise than the IPCC forecast, according to a massive new report on Antarctic Climate Change. 555pg PDF The new report incorporates recovery of the Antarctic ozone hole into temperature forecasts which predict a 3 degrees Celsius rise over Antarctica. Ozone is a powerful greenhouse gas so natural recovery of ozone levels will tend to cause rapid warming. Rapid warming is now predicted to cause a much higher loss of the west Antarctic ice sheet than the IPCC forecast.
The last time CO2 levels were around 400ppm, concentrations we are approaching now, sea levels were 50 feet or more higher than they are today. The geologic record shows that temperature changes of 2 to 3 degrees Celsius can cause sea level changes of 50-75 feet.
During the Pliocene (5-3 Ma), mean global temperatures were 2-3º C above pre-industrial values, CO2 values may have reached 400 ppm, and sea levels were 15-25 m above today’s.
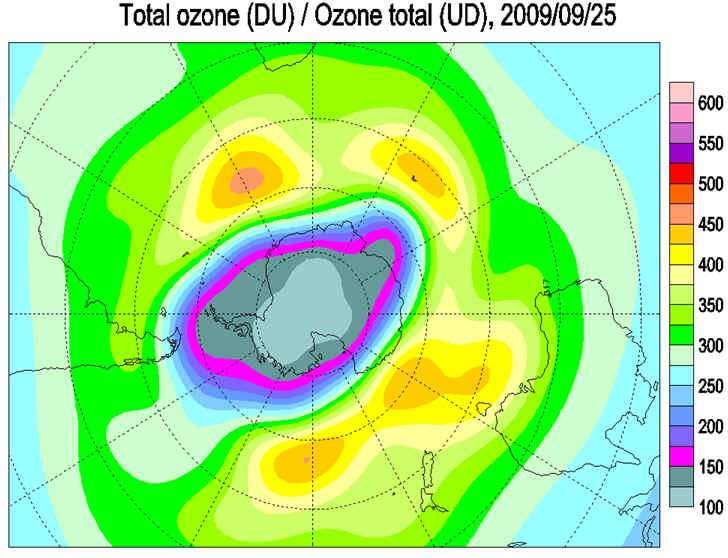
Antarctica has been spared from warming, except for the Antarctic peninsula, because cooling effects caused by the ozone hole have canceled out the warming effects of increasing levels of greenhouse gases in the atmosphere. Because ozone is a powerful greenhouse gas, the depletion of ozone caused by CFCs has cooled the stratosphere over Antarctica.
 
This Antarctic spring's ozone hole
By FishOutofWater
Introductory note
The body of this post will focus on the key observations and forecasts presented in the executive summary of the Antarctic Climate change and the Environment report. Given that the source is a very lengthy report the quoted text can serve as detailed supporting information by the reader short of time. The discussion will begin with observations to date and end with the forecasts for year 2100.
Observations
- Temperatures have stayed cold in the Antarctic interior while the rest of the southern hemisphere has been warming. The increase in temperature gradient across the southern ocean has caused winds to increase and storms to be more intense. It has also caused the strongest southern ocean currents to move closer to Antarctica.
The large scale circulation of the atmosphere
The major mode of variability in the atmospheric circulation of the high southern latitudes is the Southern Hemisphere Annular Mode (SAM), a circumpolar pattern of atmospheric mass displacement in which intensity and location of the gradient of air pressure between mid-latitudes (high pressure) and the Antarctic coast (low pressure) changes in a nonperiodic way over a wide range of time scales. Over the past 50 years the SAM became more positive, as pressure dropped around the coast of the Antarctic and increased at midlatitudes. Since the late 1970s this change increased westerly winds over the Southern Ocean by 15-20%. The combination of the stronger westerly winds around the continent, with the off-pole displacement of Antarctica, has led to a deepening of the Amundsen Sea Low, with consequent effects on temperature and sea ice in the coastal region of West Antarctica.
The SAM changed because of the increase in greenhouse gases and the development of the Antarctic ozone hole, the loss of stratospheric ozone having by far the greatest influence. The ozone hole occurs in the Austral spring. At that time of year the loss of stratospheric ozone cools the Antarctic stratosphere, so increasing the strength of the polar vortex – a large high altitude cyclonic circulation that forms in winter in the middle and upper troposphere and stratosphere over the Southern Ocean around Antarctica. During the summer and autumn the effects of the ozone hole propagate down through the atmosphere, increasing the atmospheric circulation around Antarctica at lower levels. As a result, the greatest change in the SAM, which is indicative of surface conditions, is in the autumn.
- The stronger winds have brought warming to the Antarctic peninsula and the west Antarctic ice sheet. The south pole has cooled as because of the ozone hole and less penetration of maritime air masses.
Based on data from satellites and automated weather stations, West Antarctica has warmed by about 0.1°C/decade, especially in winter and spring. Ice core data from the Siple Dome suggest that this warming began around 1800. There have been few statistically significant changes in surface temperature over the instrumental period elsewhere in Antarctica.
- The pattern warming of the troposphere and cooling of the stratosphere in Antarctica is strong evidence of being caused by man. Warming caused by solar activity or natural changes in ocean currents would not cause stratospheric cooling.
Antarctic radiosonde temperature profiles show that the troposphere has warmed at 5 km above sea level, and that the stratosphere above it has cooled over the last 30 years. This pattern would be expected from increasing greenhouse gases. The tropospheric warming in winter is the largest on Earth at this level. It may, in part, be a result of the insulating effect of greater amounts of polar stratospheric cloud during the winter. These clouds form in response to stratospheric cooling related also to the ozone hole.
- Warming along the Antarctic peninsula and in west Antarctica caused sea levels to rise faster than predicted by the IPCC over the past two decades at a rate of about 3 mm per year. The reporting scientists are concerned that melting of the coastal toes of the glaciers (like pulling up anchor on a boat) will cause instability and rapid glacial calving in the coming decades.
Ice shelves in the Antarctic Peninsula have changed rapidly in recent decades. Warming has caused retreat of ice shelves on both sides of the Peninsula. Loss of ice on the eastern side results from warm air being brought over the Peninsula by the stronger westerlies forced by changes in the SAM, driven ultimately by the development of the ozone hole. Ice-shelf retreat results from increased fracturing via melt-water infilling of pre-existing crevasses, and the penetration of warm ocean masses beneath ice shelves. Removal of ice shelves has led to the speeding up of glacier flow from inland.
Some formerly snow- and ice-covered islands are now increasingly snow-free during the summer. Glaciers on Heard Island reduced by 11% since the 1940s, and several coastal lagoons have formed there. On South Georgia, 28 of 36 surveyed glaciers are retreating, 2 are advancing, and 6 are stable. On Signy Island ice cover has reduced by around 40%.
Of the 244 marine glaciers that drain the ice sheet and associated islands of the Antarctic Peninsula, 212 (87%) have shown overall retreat since 1953. The other 32 glaciers have shown small advances.
The Amundsen Sea sector is the most rapidly changing region of the Antarctic ice sheet. The grounding line at Pine Island has retreated, and the Pine Island Glacier is now moving at speeds 60% higher than in the 1970s. The Thwaites Glacier and four other glaciers in this sector show accelerated thinning. Smith Glacier has increased flow speed 83% since 1992. The Pine Island and adjacent glacier systems are currently more than 40% out of balance, discharging 280 ± 9 Gt per year of ice, while they receive only 177 ± 25 Gt per year of new snowfall. The current rate of mass loss from the Amundsen Sea embayment ranges from 50 to 137 Gt per year, equivalent to the current rate of mass loss from the entire Greenland ice sheet, and making a significant contribution to sea level rise.
The changes result from warming of the sea beneath the ice shelves connected to the glaciers. The stronger winds associated with the more positive SAM drive warm Circumpolar Deep Water up against the western Peninsula coast and the Amundsen Sea coast.
- Higher wind speeds and stronger storms are mixing the waters around Antarctica more, reducing the uptake of CO2 from the atmosphere. The strong mixing brings up water enriched in CO2 by the oxidation of sinking organic matter. The high CO2 water is becoming increasingly acidic, increasingly inhospitable to the growth of the shells of important marine organisms.
The Southern Ocean ventilates the global oceans and regulates the climate system by taking up and storing heat, freshwater, O2 and atmospheric CO2. From 1991 - 2007 the concentration of CO2 in the ocean increased south of 20°S in the Southern Indian Ocean. At latitudes pole-ward of 40°S, CO2 in the ocean increased faster than it did in the atmosphere, suggesting that the ocean became less effective as a sink for atmospheric CO2. The stronger westerly winds lead to surface oceanic water being mixed with deeper water rich in CO2, which saturates the carbon reservoir of the surface water, thus limiting its ability to absorb carbon dioxide from the atmosphere These changes seem to be linked to the increase in wind strength driven by the more positive SAM. An increase in the ocean’s CO2 content makes the ocean more acidic.
________________________________________________________________________
Predictions for 2100
A seal level rise of 1.5m (4.6 feet) would devastate southern Florida and southern Louisiana. Charleston, South Carolina would be under water and North Carolina's outer banks would be gone.
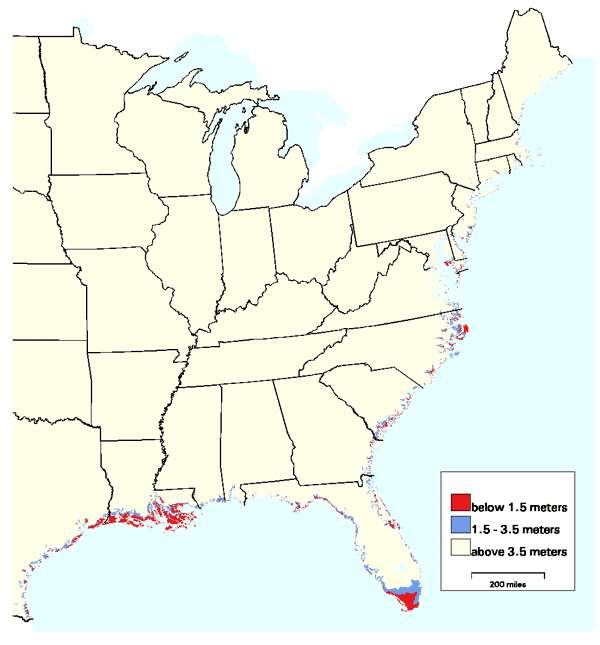
By FishOutofWater • EPA maps of continental U.S. areas vulnerable to sea level rise.
Forecasts are based on a doubling of atmospheric CO2 based on IPCC scenarios. Actual CO2 emissions rates over the past decade have been going up faster than the IPCC predicted. However, strong measures to reduce emissions can reduce Antarctic warming and sea level rise.
The degree to which the Earth’s climate will change over the next century is dependent on the success of efforts to reduce greenhouse gas (GHG) emissions. The ACCE report focuses on outputs from IPCC models that assumed a doubling of CO2 and other gases by 2100. These outputs may be too conservative, given that some indicators are already changing faster than predicted in IPCC projections.
The strongest Antarctic warming will be in coastal areas that are warmed by ocean water that was formerly covered by sea ice.
The models project significant surface warming over Antarctica to 2100 AD, by 0.34°C/decade over land and grounded ice sheets, within a range from 0.14 to 0.5°C/decade. Over land, the largest increase is projected for the high-altitude interior of East Antarctica. Despite this change, the surface temperature by the year 2100 will remain well below freezing over most of Antarctica and will not contribute to melting inland.
The largest atmospheric warming projected by the models is over the sea ice zone in winter (0.51 ± 0.26°C/decade off East Antarctica), because of the retreat of the sea-ice edge and the consequent exposure of the ocean.
The predicted rate of warming of 3°C is unprecedented in ice cores for Antarctica.
The warming of 3°C over the next century is faster than the fastest rate of rise seen in Antarctic ice cores (4°C per 1000 years), but it is comparable to or slower than the rates of temperature rise typical of Dansgaard-Oeschger events during glacial times in Greenland, of the Bolling-Allerød warming in Greenland 14,700 years ago, and of the warming in Greenland at the end of the Younger Dryas around 11,700 years ago.
The IPCC's latest forecast of sea level rise was likely an underestimate. The IPCC's predictions of ice sheet movement neglected dynamic ice sheet flow which has been observed in Greenland and Antarctica. Improved models incorporating dynamic flow predict over twice as much glacial ice loss as IPCC models did. The increased ice sheet melting will cause sea levels to rise by as much as 1.4m (4.6feet) by 2100.
The IPCC’s Fourth Assessment Report projected a range of global sea-level increase from 18 to 59 cm between 1980-1999 and 2090-2099. This did not include a contribution from the dynamically driven changes in flow for portions of either the Greenland or Antarctic ice sheets. Recent modeling suggests that by 2100 global sea level may rise by 1.4m rather than the IPCC’s suggested 59 cm. Sea level will not rise uniformly. The spatial pattern of sea-level rise projections shows a minimum in sea-level rise in the Southern Ocean and a maximum in the Arctic Ocean.
Conclusions
The economic costs of business as usual have been seriously underestimated by using IPCC's forecasts of sea level rise. The costs will be far higher with the 4.6 foot rise now forecast than for the IPCC's maximum of a 2 foot rise over the next hundred years. Moreover, the geologic record shows that sea levels were 50 to 75 feet higher the last time temperatures were 2 to 3 degrees Celsius higher. The geologic evidence shows that the improved models may still be underestimating sea level rise and economic consequences.
 GreenRoots is a new environmental series created by Meteor Blades and Patriot Daily for Daily Kos. This series provides a forum for educating, brainstorming, discussing and taking action on various environmental topics.
Please join a variety of hosts on Sunday, Tuesday, and Thursday at 6 pm PDT. Each Wednesday is hosted by FishOutofWater.
