Think back to whatever math class you took last, and you'll probably recall the concept of a function, which associates an "output" value for each of its "input" values. Much has been said about the Bush tax cuts, the Obama tax cut, and the Obama-McConnell tax deal, but I think one of the best ways to get a sense of how they all relate is to treat tax rates as functions and graph the tax paid for any given income level.
Below, I'll present the graphs I have produced, with some commentary on each. I'll then include the full details of how I obtained these numbers. I welcome feedback and criticism on the analysis, so please take a careful look at my numbers and methodology if you're so inclined. If I get constructive feedback that I can use to make this write-up even better, I may make a "version 2.0" of this later.
The one overarching conclusion revealed by all these graphs is that in recent times, tax rates have never been lower than under Obama. The specifics follow.
First, let's look at tax rates for a married couple making up to $70,000 per year:
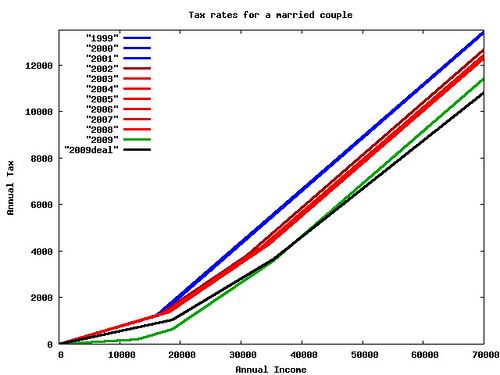
For all these graphs, blue indicates Clinton-era tax rates; red indicates Bush-era tax rates. The 2009 tax rates incorporating Obama's Making Work Pay tax credit are in green. Finally, the black line shows what the 2009 tax rates would be if the new tax deal were applied for that year. Everything is adjusted to 2009 dollars.
This graph clearly shows the effect of the first Bush tax cut, which took effect in 2002. (I've put it in a slightly different shade of red to distinguish it from the further cuts that applied for 2003, though they are about the same in this income range.) The Obama tax cut is also apparent from the position of the green line relative to the others. Notice how the blue, red, and green lines are essentially parallel in the right half of the graph, with the Bush rates about halfway between the Clinton and Obama rates. This means that for many earners, Bush and Obama each cut their taxes by a fixed number of dollars, regardless of income. Furthermore, Obama cut their taxes by as much again as Bush did.
For anyone with a low enough income to be on the left half of the graph, the new tax deal has the unfortunate effect of raising their taxes relative to the current rates. However, it's still lower than the Bush rates ever were. If you're on the right half, your taxes have reached a new low.
Now let's zoom out a bit and look at the rates for a couple making up to $300,000:
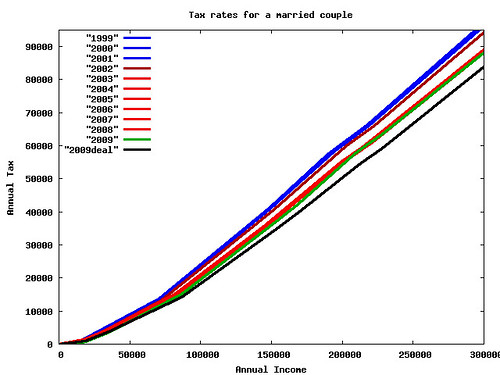
Here, you can see that for moderately wealthy earners, the Bush cuts of 2002 didn't make much difference, but the ones starting in 2003 sure did. The more a couple made, the better the 2003 cut was. You can also see that the Obama rates were no higher, and are just a little bit lower until you reach the phase-out for the Making Work Pay credit. For anyone on the right half of this graph, the new tax deal is a big win---it's almost like getting the 2003 Bush tax cuts all over again. The more you make, the more you win.
Now, lets zoom out even further and look at the picture for a couple making up to $1,000,000:
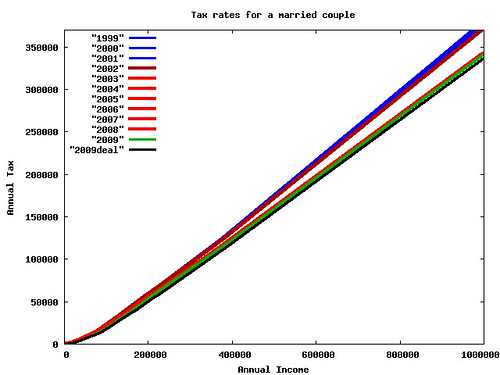
At this scale, about the only thing that matters is the Bush tax cut that kicked in in 2003. All the lines before that are essentially the same, and all the ones after are pretty close. (I actually had to make the red lines with a broader stroke so they wouldn't disappear behind the green one.) And yet, it's still apparent from this graph that the Obama-McConnell tax deal makes taxes on the super-wealthy even lower than they've ever been.
So, some conclusions we can reach:
For most people, in 2009 Barack Obama incrementally cut their taxes by the same amount that George Bush did. The fact that this is widely unrecognized when it is so easy to observe graphically is, in my opinion, a huge missed opportunity in messaging.
We've blasted another big hole in the federal government's revenue.
Regardless of how you feel about the Obama-McConnell tax deal, passing nothing would have been a hit to the economy, because of the double whammy of both the Bush and Obama tax cuts expiring for tax year 2011.
Overall, contemporary tax rates have never been lower than under Obama.
The following are some comments about how I produced these graphs, and all the data that went into them:
First, these graphs are an oversimplification of an extremely complicated tax code. They basically assume earners with all income coming from wages, with no special deductions or credits. But, this assumption seems to me like a good way to model the most basic components of our income tax system.
The graphs combine regular income tax, OASDI (Social Security), and Medicare rates.
I made no effort to account for the capital gains rate, which often gives high earners an even bigger tax break than these graphs indicate.
I chose to analyze rates for a married couple. The relative rates for single earners are comparable. To some extent, the analysis assumes both partners earn the same amount of money. This isn't likely to be true.
I chose to rework the 2009 tax rates as if the new tax deal were in effect because that's easier than trying to project ahead to what everything will be in 2011.
All the lines are adjusted to 2009 dollars by using the CPI from July of each year.
I assumed the standard deduction and two exemptions, and applied the tax rates to what was left after subtracting those. For Social Security and Medicare, I multiplied by the original income with no deductions.
I treated the Making Work Pay tax credit as cancelling out the first $800 of Social Security, because that's basically what it does.
None of this is tax advice. Don't use these graphs to file your taxes.
Again, this is a simplification for the purposes of modeling, but are there any major components of the tax system that I overlooked and should have taken into account? Are there any errors in my computation of the parts that I did take into account? I appreciate any feedback that can help make this analysis more solid and relevant to the casual reader.
Some handy links for data:
www.irs.gov
Social Security & Medicare Tax Rates
Social Security Contribution and Benefit Base
Consumer Price Index
The values I used to produce the graphs follow:
---- 1999

    income deduct exempt    taxable	  tax oasdi+hc total tax    cpi cpi income   cpi tax notes

      0.00	0      0       0.00	 0.00	  0.00	    0.00 166.70       0.00	0.00
  12700.00   7200   5500       0.00	 0.00	971.55	  971.55 166.70   16406.46   1255.09 15%
start
  55750.00   7200   5500   43050.00   6457.50  4264.88	10722.38 166.70   72020.51  13851.67 28%
start
 116750.00   7200   5500  104050.00  23537.50  8931.38	32468.88 166.70  150823.21  41944.84 31%
start
 145200.00   7200   5500  132500.00  32357.00 11107.80	43464.80 166.70  187576.28  56149.90 oasdi
breakpoint
 171250.00   7200   5500  158550.00  40432.50 11485.53	51918.03 166.70  221228.91  67070.18 36%
start
 295850.00   7200   5500  283150.00  85288.50 13292.23	98580.73 166.70  382193.12 127351.28 39.6%
start
1012700.00   7200   5500 1000000.00 369161.10 23686.55 392847.65 166.70 1308254.10 507499.31

---- 2000

    income deduct exempt    taxable	  tax oasdi+hc total tax    cpi cpi income   cpi tax notes

      0.00	0      0       0.00	 0.00	  0.00	    0.00 172.80       0.00	0.00
  12950.00   7350   5600       0.00	 0.00	990.68	  990.68 172.80   16138.86   1234.62 15%
start
  56800.00   7350   5600   43850.00   6577.50  4345.20	10922.70 172.80   70786.67  13612.35 28%
start
 118900.00   7350   5600  105950.00  23965.50  9095.85	33061.35 172.80  148178.44  41202.52 31%
start
 152400.00   7350   5600  139450.00  34350.50 11658.60	46009.10 172.80  189927.62  57338.57 oasdi
breakpoint
 174400.00   7350   5600  161450.00  41170.50 11977.60	53148.10 172.80  217344.99  66235.51 36%
start
 301300.00   7350   5600  288350.00  86854.50 13817.65 100672.15 172.80  375493.38 125462.08 39.6%
start
1012950.00   7350   5600 1000000.00 368667.90 24136.58 392804.48 172.80 1262383.08 489530.30

---- 2001

    income deduct exempt    taxable	  tax oasdi+hc total tax    cpi cpi income   cpi tax notes

      0.00	0      0       0.00	 0.00	  0.00	    0.00 177.50       0.00	0.00
  13400.00   7600   5800       0.00	 0.00  1025.10	 1025.10 177.50   16257.48   1243.70 15%
start
  58600.00   7600   5800   45200.00   6780.00  4482.90	11262.90 177.50   71096.16  13664.66 27.5%
start
 122650.00   7600   5800  109250.00  24393.75  9382.73	33776.48 177.50  148804.51  40979.14 30.5%
start
 160800.00   7600   5800  147400.00  36029.50 12301.20	48330.70 177.50  195089.81  58636.98 oasdi
breakpoint
 179900.00   7600   5800  166500.00  41855.00 12578.15	54433.15 177.50  218262.79  66040.75 35.5%
start
 310750.00   7600   5800  297350.00  88306.75 14475.48 102782.23 177.50  377015.91 124700.03 39.1%
start
1013400.00   7600   5800 1000000.00 363042.90 24663.90 387706.80 177.50 1229502.55 470383.36

---- 2002

    income deduct exempt    taxable	  tax oasdi+hc total tax    cpi cpi income   cpi tax notes

      0.00	0      0       0.00	 0.00	  0.00	    0.00 180.10       0.00	0.00
  13850.00   7850   6000       0.00	 0.00  1059.53	 1059.53 180.10   16560.86   1266.91 10%
start
  25850.00   7850   6000   12000.00   1200.00  1977.53	 3177.53 180.10   30909.62   3799.46 15%
start
  60550.00   7850   6000   46700.00   6405.00  4632.08	11037.08 180.10   72401.46  13197.36 27%
start
 126700.00   7850   6000  112850.00  24265.50  9692.55	33958.05 180.10  151499.01  40604.66 30%
start
 169800.00   7850   6000  155950.00  37195.50 12989.70	50185.20 180.10  203034.98  60007.96 oasdi
breakpoint
 185800.00   7850   6000  171950.00  41995.50 13221.70	55217.20 180.10  222166.66  66024.87 35%
start
 320900.00   7850   6000  307050.00  89280.50 15180.65 104461.15 180.10  383709.81 124907.35 38.6%
start
1013850.00   7850   6000 1000000.00 356759.20 25228.43 381987.62 180.10 1212291.01 456754.12

---- 2003

    income deduct exempt    taxable	  tax oasdi+hc total tax    cpi cpi income   cpi tax notes

      0.00	0      0       0.00	 0.00	  0.00	    0.00 183.90       0.00	0.00
  15600.00   9500   6100       0.00	 0.00  1193.40	 1193.40 183.90   18267.95   1397.50 10%
start
  29600.00   9500   6100   14000.00   1400.00  2264.40	 3664.40 183.90   34662.26   4291.09 15%
start
  72400.00   9500   6100   56800.00   7820.00  5538.60	13358.60 183.90   84782.01  15643.22 25%
start
 130250.00   9500   6100  114650.00  22282.50  9964.13	32246.62 183.90  152525.65  37761.52 28%
start
 174000.00   9500   6100  158400.00  34532.50 13311.00	47843.50 183.90  203757.88  56025.81 oasdi
breakpoint
 190300.00   9500   6100  174700.00  39096.50 13547.35	52643.85 183.90  222845.54  61647.12 33%
start
 327550.00   9500   6100  311950.00  84389.00 15537.48	99926.48 183.90  383568.35 117016.13 35%
start
1015600.00   9500   6100 1000000.00 325206.50 25514.20 350720.70 183.90 1189290.24 410701.76

---- 2004

    income deduct exempt    taxable	  tax oasdi+hc total tax    cpi cpi income   cpi tax notes

      0.00	0      0       0.00	 0.00	  0.00	    0.00 189.40       0.00	0.00
  15900.00   9700   6200       0.00	 0.00  1216.35	 1216.35 189.40   18078.57   1383.01 10%
start
  30200.00   9700   6200   14300.00   1430.00  2310.30	 3740.30 189.40   34337.91   4252.78 15%
start
  74000.00   9700   6200   58100.00   8000.00  5661.00	13661.00 189.40   84139.25  15532.79 25%
start
 133150.00   9700   6200  117250.00  22797.50 10185.98	32983.48 189.40  151393.80  37502.77 28%
start
 175800.00   9700   6200  159900.00  34732.55 13448.70	48181.25 189.40  199887.57  54782.90 oasdi
breakpoint
 194550.00   9700   6200  178650.00  39979.50 13720.58	53700.07 189.40  221206.64  61057.89 33%
start
 335000.00   9700   6200  319100.00  86328.00 15757.10 102085.10 189.40  380900.66 116072.48 35%
start
1015900.00   9700   6200 1000000.00 324643.00 25630.15 350273.15 189.40 1155095.46 398266.49

---- 2005

    income deduct exempt    taxable	  tax oasdi+hc total tax    cpi cpi income   cpi tax notes

      0.00	0      0       0.00	 0.00	  0.00	    0.00 195.40       0.00	0.00
  16400.00  10000   6400       0.00	 0.00  1254.60	 1254.60 195.40   18074.50   1382.70 10%
start
  31000.00  10000   6400   14600.00   1460.00  2371.50	 3831.50 195.40   34165.20   4222.71 15%
start
  75800.00  10000   6400   59400.00   8180.00  5798.70	13978.70 195.40   83539.44  15405.97 25%
start
 136350.00  10000   6400  119950.00  23317.50 10430.78	33748.28 195.40  150271.80  37194.09 28%
start
 180000.00  10000   6400  163600.00  35539.50 13770.00	49309.50 195.40  198378.61  54344.17 oasdi
breakpoint
 199200.00  10000   6400  182800.00  40915.50 14048.40	54963.90 195.40  219538.99  60575.90 33%
start
 342850.00  10000   6400  326450.00  88320.00 16131.33 104451.32 195.40  377856.14 115116.16 35%
start
1016400.00  10000   6400 1000000.00 324062.50 25897.80 349960.30 195.40 1120177.87 385692.43

---- 2006

    income deduct exempt    taxable	  tax oasdi+hc total tax    cpi cpi income   cpi tax notes

      0.00	0      0       0.00	 0.00	  0.00	    0.00 203.50       0.00	0.00
  16900.00  10300   6600       0.00	 0.00  1292.85	 1292.85 203.50   17884.19   1368.14 10%
start
  32000.00  10300   6600   15100.00   1510.00  2448.00	 3958.00 203.50   33863.55   4188.50 15%
start
  78200.00  10300   6600   61300.00   8440.00  5982.30	14422.30 203.50   82754.05  15262.20 25%
start
 140600.00  10300   6600  123700.00  24040.00 10755.90	34795.90 203.50  148787.96  36822.27 28%
start
 188400.00  10300   6600  171500.00  37424.00 14412.60	51836.60 203.50  199371.64  54855.35 oasdi
breakpoint
 205350.00  10300   6600  188450.00  42170.00 14658.38	56828.38 203.50  217308.74  60137.82 33%
start
 353450.00  10300   6600  336550.00  91043.00 16805.83 107848.82 203.50  374033.47 114129.50 35%
start
1016900.00  10300   6600 1000000.00 323250.00 26425.85 349675.85 203.50 1076120.06 370039.53

---- 2007

    income deduct exempt    taxable	  tax oasdi+hc total tax    cpi cpi income   cpi tax notes

      0.00	0      0       0.00	 0.00	  0.00	    0.00 208.30       0.00	0.00
  17500.00  10700   6800       0.00	 0.00  1338.75	 1338.75 208.30   18092.47   1384.07 10%
start
  33150.00  10700   6800   15650.00   1565.00  2535.98	 4100.98 208.30   34272.30   4239.81 15%
start
  81200.00  10700   6800   63700.00   8772.50  6211.80	14984.30 208.30   83949.04  15491.60 25%
start
 146000.00  10700   6800  128500.00  24972.50 11169.00	36141.50 208.30  150942.86  37365.08 28%
start
 195000.00  10700   6800  177500.00  38692.50 14917.50	53610.00 208.30  201601.76  55424.98 oasdi
breakpoint
 213350.00  10700   6800  195850.00  43830.50 15183.58	59014.08 208.30  220573.00  61012.01 33%
start
 367200.00  10700   6800  349700.00  94601.00 17414.40 112015.40 208.30  379631.62 115807.70 35%
start
1017500.00  10700   6800 1000000.00 322206.00 26843.75 349049.75 208.30 1051947.64 360866.89

---- 2008

    income deduct exempt    taxable	  tax oasdi+hc total tax    cpi cpi income   cpi tax notes

      0.00	0      0       0.00	 0.00	  0.00	    0.00 219.96       0.00	0.00
  17900.00  10900   7000       0.00	 0.00  1369.35	 1369.35 219.96   17524.61   1340.63 10%
start
  33950.00  10900   7000   16050.00   1605.00  2597.18	 4202.18 219.96   33238.01   4114.05 15%
start
  83000.00  10900   7000   65100.00   8962.50  6349.50	15312.00 219.96   81259.36  14990.88 25%
start
 149350.00  10900   7000  131450.00  25550.00 11425.28	36975.28 219.96  146217.89  36199.84 28%
start
 204000.00  10900   7000  186100.00  40852.00 15606.00	56458.00 219.96  199721.79  55273.98 oasdi
breakpoint
 218200.00  10900   7000  200300.00  44828.00 15811.90	60639.90 219.96  213623.99  59368.18 33%
start
 375600.00  10900   7000  357700.00  96770.00 18094.20 114864.20 219.96  367723.06 112455.31 35%
start
1017900.00  10900   7000 1000000.00 321575.00 27407.55 348982.55 219.96  996552.99 341663.82

---- 2009

    income deduct exempt    taxable	  tax oasdi+hc total tax    cpi cpi income   cpi tax notes

      0.00	0      0       0.00	 0.00	  0.00	    0.00 215.35       0.00	0.00
  12903.23   5603   7300       0.00	 0.00	187.10	  187.10 215.35   12903.23    187.10
stimulus breakpoint
  18700.00  11400   7300       0.00	 0.00	630.55	  630.55 215.35   18700.00    630.55 10%
start
  35400.00  11400   7300   16700.00   1670.00  1908.10	 3578.10 215.35   35400.00   3578.10 15%
start
  86600.00  11400   7300   67900.00   9350.00  5824.90	15174.90 215.35   86600.00  15174.90 25%
start
 155750.00  11400   7300  137050.00  26637.50 11114.88	37752.38 215.35  155750.00  37752.38 28%
start
 168700.00  11400   7300  150000.00  30263.50 12105.55	42369.05 215.35  168700.00  42369.05
phaseout start
 208700.00  11400   7300  190000.00  41463.50 15965.55	57429.05 215.35  208700.00  57429.05
phaseout end
 213600.00  11400   7300  194900.00  42835.50 16340.40	59175.90 215.35  213600.00  59175.90 oasdi
breakpoint
 227550.00  11400   7300  208850.00  46741.50 16542.68	63284.18 215.35  227550.00  63284.18 33%
start
 391650.00  11400   7300  372950.00 100894.50 18922.13 119816.62 215.35  391650.00 119816.62 35%
start
1018700.00  11400   7300 1000000.00 320362.00 28014.35 348376.35 215.35 1018700.00 348376.35

---- 2009deal

    income deduct exempt    taxable	  tax oasdi+hc total tax    cpi cpi income   cpi tax notes

      0.00	0      0       0.00	 0.00	  0.00	    0.00 215.35       0.00	0.00
  18700.00  11400   7300       0.00	 0.00  1056.55	 1056.55 215.35   18700.00   1056.55 10%
start
  35400.00  11400   7300   16700.00   1670.00  2000.10	 3670.10 215.35   35400.00   3670.10 15%
start
  86600.00  11400   7300   67900.00   9350.00  4892.90	14242.90 215.35   86600.00  14242.90 25%
start
 155750.00  11400   7300  137050.00  26637.50  8799.88	35437.38 215.35  155750.00  35437.38 28%
start
 168700.00  11400   7300  150000.00  30263.50  9531.55	39795.05 215.35  168700.00  39795.05
phaseout start
 208700.00  11400   7300  190000.00  41463.50 11791.55	53255.05 215.35  208700.00  53255.05
phaseout end
 213600.00  11400   7300  194900.00  42835.50 12068.40	54903.90 215.35  213600.00  54903.90 oasdi
breakpoint
 227550.00  11400   7300  208850.00  46741.50 12270.68	59012.18 215.35  227550.00  59012.17 33%
start
 391650.00  11400   7300  372950.00 100894.50 14650.13 115544.62 215.35  391650.00 115544.62 35%
start
1018700.00  11400   7300 1000000.00 320362.00 23742.35 344104.35 215.35 1018700.00 344104.35
