Tracking the Oil Spill in the Gulf
New York Times, May 31, 2010
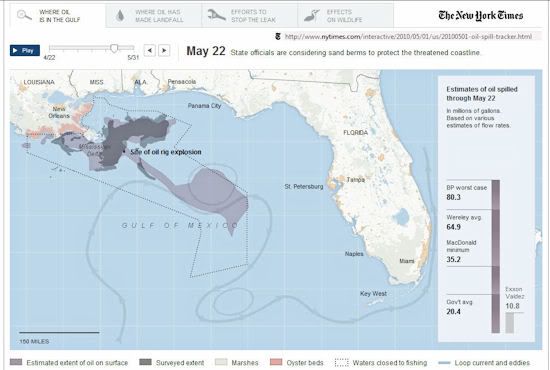
larger image
Check out that link, for a VERY Good interactive map of tracking the Oil Sheens in the Gulf, day-by-day.
The Map has a 'slider bar' that lets you follow the Surface Oil for any Day you choose. You can even make it a movie -- just click play!
Be sure to check out the Tab Pages too -- lots of Good Info there too.
After looking over the Data, and the various estimates of "Barrels per Day" -- I was left wondering, just ...
How BIG is 12 Thousand Barrels, anyways? (the current "Best Case Scenario")
...
First a break down of the Facts presented in that insightful NYTimes article:
Tracking the Oil Spill in the Gulf
New York Times -- Monday, May 31, 2010
About the Oil Slick Areas Shown on the Map
The "estimated extent" of the oil slick is an estimate by the National Oceanic and Atmospheric Administration of where oil is mostly likely to go based on wind and ocean current forecasts, as well as analysis of aerial photography and satellite imagery.
The "surveyed extent" show areas where oil was visible on the surface of the water during aerial surveys of the Gulf. The observed extents are not available every day. The extents may vary widely from day to day because of changes in wind patterns and ocean currents.
The loop currents are from NOAA and from Roffer’s Ocean Fishing Forecasting Service.
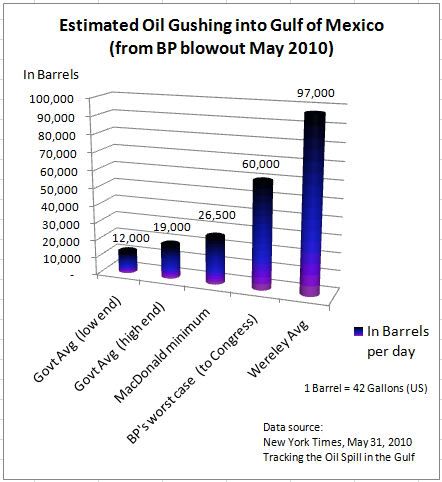
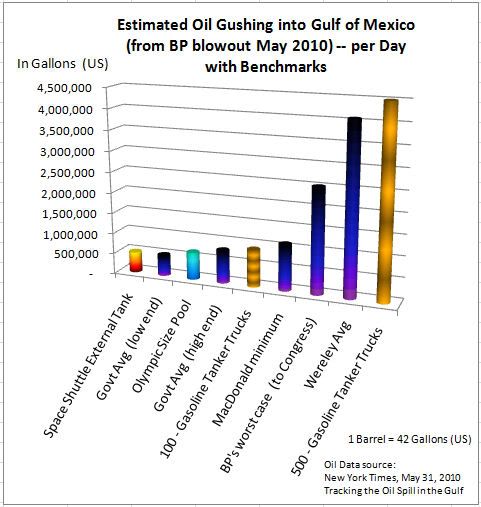
The "Gov’t avg." is the average of the upper and lower bounds (12,000 to 19,000 barrels per day) of an estimate announced May 27. The estimates were produced by a panel of experts from universities, government laboratories and government agencies.
[...]
The "MacDonald minimum" is based on an analysis by Ian R. MacDonald, an oceanographer at Florida State University that was published by SkyTruth on May 1. By studying the amount of the oil visible in aerial imagery, Dr. MacDonald calculated the flow rate to be at least 26,500 barrels (1.1 million gallons) per day.
[...]
The "BP worst case" estimate is based on a figure given by a senior BP executive to members of Congress in a closed-door briefing on May 4. The executive acknowledged that in the worst case, if the leak accelerated, the flow rate could be 60,000 barrels (or 2.5 million gallons) a day.
[...]
The "Wereley avg." is based on estimates by Steve Wereley, a professor of mechanical engineering at Purdue University and an expert in optical flow measurement. He presented his findings to Congress on May 19. He analyzed video of the oil and gas leaking at the bottom of the gulf and estimated the flow rate to be about 72,000 barrels (or 3.0 million gallons) a day coming from the riser pipe and an additional 25,000 barrels coming from the blow out preventer.
[ 72,000 + 25,000 = 97,000 Barrels per day, according to engineer Steve Wereley's report to Congress ]
That's all well and good, but they are just Numbers on a page. A little help please, so we might be able to 'compare Apples to Oranges'.
Well OK, ranking all those Barrels from Lowest to Highest, using my favorite data analysis tool Excel, all those Numbers kind of look like this:
What about if we plot out the Gallons instead?
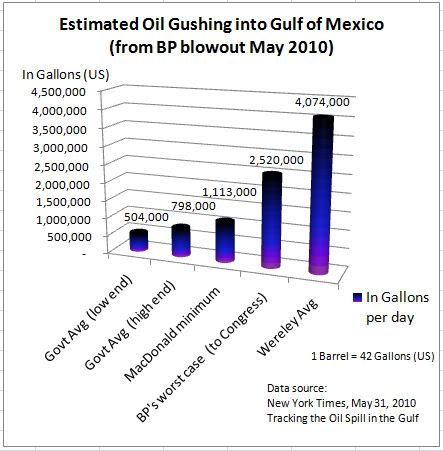
Well that kind of looks like the same thing, doesn't it?
It would really help if we had some common "frame of reference" -- those are just bars on a page.
What do they Mean? ... in other words How BIG is Big?
This is one of those Math-Science Challenges, that have frequently peaked my interest, over the years.
In most cases, a Number is just a Number, until you "put in everyday terms", that people can relate to.
Take a Million Dollars for example, it's just another Big Number. It could be interchangeable with a Billion, the way they toss around such Numbers like this, in the News. ... BUT in real life, a Million Dollars is WAY Different than a Billion Dollars, but by how much?
How can we visualize large Numbers, without 'our eyes glazing over'?
Well Charts can help. But as we seen in those previous Charts, something still missing.
Well breaking it down into "Multiples of Something else" can help too.
For example, did you know that:
A Million Dollars = a 1,000 $Thousands ... [Most folk have some idea how big $1000.00 is.]
and
A Billion Dollars = a 1,000 $Millions ... [Wow, that's a lot of Millions.]
or
A Billion Dollars = a 1,000,000 $Thousands ...
[A Million Thousands ... No Wonder CEO's do what they do. They have their Price.]
That helps some, but what about "putting in everyday terms", that people can relate to?
Well, let me give you a few "Bench Marks" you can relate to.
[PS. I love Benchmarks. They help me 'get it'.]
Everyone knows how long a Second is ... it goes by in a blink of an eye.
Well did you know, that in a Day, we experience 86,400 seconds?
1 Day = 60 Seconds x 60 Minutes x 24 hours = 86,400 Seconds. [Benchmark 1]
And in a Year?
1 Year = 365.24 Days x 86,400 Seconds = 31,556,736 Seconds. [Benchmark 2]
OK, so HOW BIG is a Million then, using our new Yardstick, aka. the Stopwatch?
A Million seconds is:
1,000,000 / 86,400 Seconds = 11.6 Days. [Benchmark 3]
(nearly 12 Days-worth of Seconds.)
If takes almost 2 weeks days, to get to a Million, on this Scale.
OK, HOW BIG is a Billion then, using this metric?
A Billion seconds is:
1,000,000,000 / 86,400 Seconds = 11,574.1 Days,
or
11,574.1 Days / 365.24 = 31.7 Years. [Benchmark 4]
(nearly 32 Years-worth of Seconds.)
Wow ... it really is like 'Sands in an Hourglass' ...
So if you want to be a Billionaire then, and if you could make $1 per Second ... well it will take you about 32 years. Better get cracking!
(For a bit more context, it takes BP about a Month, to make Billion Dollars in Profit -- in a 'Good Year'. I guess, they're making WAY more than a Dollar a Second.)
So hopefully now 'you get' why I like "Benchmarks" so much -- They help me 'get it' ... get what all those BIG Numbers mean.
Follow with me now, as I try to find some similar "common sense" Bench Marks, that can help us to understand how much Oil is flowing into the Gulf of Mexico, each day. I'm going to boil it down into Gallons, because most folks, know how Big a Gallon of Milk is.
How Big Is an Olympic Size Pool?
660,253 gallons of water
Link
How many Gallons of gas does a tanker truck hold?
Typically about 9,000 gallons
http://wiki.answers.com/...
OK here's another "big tank" that most of us can relate to:
NASA Space Shuttle
The 15-story tall, rust-colored external tank is the only shuttle element that isn't reused. It feeds more than half a million gallons of fuel to the shuttle's three main engines during launch.
The huge rust-colored External Tank (ET), which feeds fuel to three Space Shuttle Main Engines (SSMEs) during launch ...
http://mynasa.nasa.gov/...
Since 1 Barrel of Oil = 42 US Gallons Link
then 500,000 gallons divided by 42 = 11,905 Barrels ....
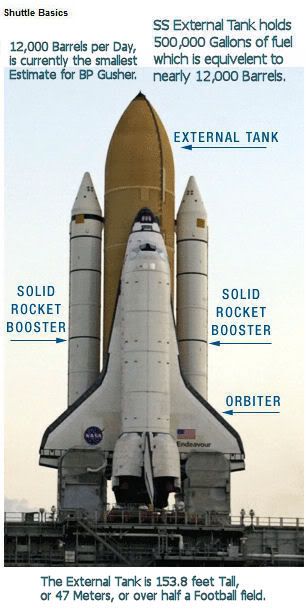
The Space Shuttle External Tank, which holds 500,000 Gallons of Fuel,
is an equivalent Benchmark, for 12,000 Barrels Oil.
And 12,000 Barrels per Day,
is currently the smallest
estimate for BP Gusher.
(using the "Gov't Avg." lower boundary, from the intro article.)
So here are my new Gallon Benchmarks, plotted next to the Oil per Day Estimates, given in the NYTimes article:
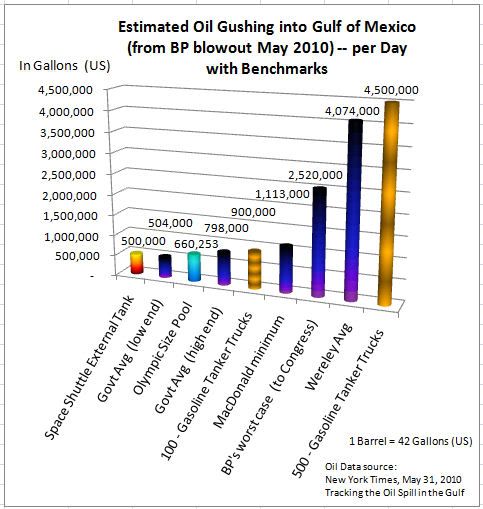
Here's that same Chart without all those distracting 'Numbers' ...
SO ... How BIG is 12 Thousand Barrels, anyways? (the current "Best Case Scenario")
Here's your Apples and Oranges, comparison.
At minimum, it's 1 Space Shuttle External Tank per Day, for How Many MORE Days?
-- that's a LOT of Rocket Fuel!
(Extra Credit: Extrapolate this out to Imagine 500 - Gasoline Tanker Trucks, crashing and splitting open each day, if you'd rather 'have a handle' on the current "Worst Case Scenario". It's No wonder Americans are upset. If you're not Mad, you're Not paying Attention.)
[For the geeks among us: 8.1 Shuttle Flights per Day, is the marker for the "worst case".]
And just for Fun now (whew, we need it), and to add a bit more everyday perspective:
And How Tall is that External Tank?
The External Tank is 153.8 Feet Tall,
or 47 Meters ...
Link
Or over half a Football field tall ... Hmmmm ... I thought it was taller.
That Tank is Big enough, and Tall enough to Launch a Thousand Dreams ...
if it were not all flowing out, harmfully, into the open Sea, that is.
Energy Potential ... Untapped. Wasted. Piling up, day-by-day.

As a Country ... We used to be Better than this.
Maybe someday we will be again.
One can dream ... that's still on the Table, right?
Visualizing the World ... the way, it should be.


