Detail level census data for New York State is now available at the US Census web site.
They provide a nice map tool that unfortunately is not compatible with DailyKos. Fortunately, they also provide 2 map pictures. This one shows the percentage of change by county:
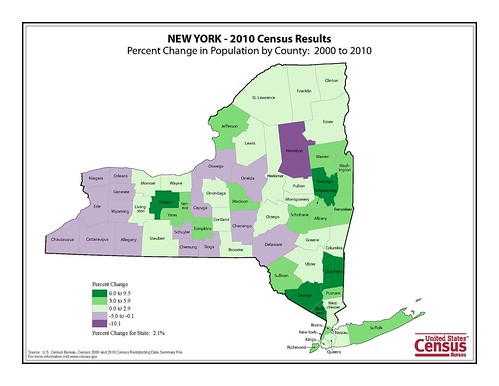
With deep green being largest gains and deep purple being counties with largest losses.
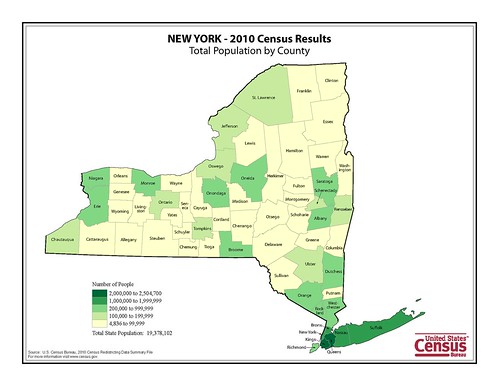
This one shows total population by county:
NYPIRG has made an analysis of the data. Their press release summary with link to detailed pdf can be found here.
New York State will lose 2 congressional seats from 29 down to 27 beginning in 2012. Each Congressional District will contain 717,707 people. Following the last census districts consisted of 654,360 people. NYPIRG's pdf has nice chart's listing each Congressional, State Senate, and Assembly District along with the 2000 and 2010 populations and the "shift" or change in population between the two censuses.
The Census Bureau website allows you to view the data in many different breakdowns. I have downloaded a few of them for later analysis but quickly reviewed the census data by county in order to estimate how the new 27 district map might look.
By my estimation there will be:
4 CD's on Long Island with the 4th needing a sliver of Queens to make its population requirement.
11 New York City districts with almost a quarter million left over to merge into a Westchester district
4 Lower Hudson Valley districts
1 Capital Region District
1 North Country District
2 Central New York Districts
4 Western New York Districts
The rules for drawing districts have not been determined yet. No matter what rules are put into place there are many ways to draw districts. Even with a strict, non-partisan, compact and contiguous, process like the one out-lined in Mike Gianaris' old Assembly bill there are still multiple ways to draw lines that meet the criteria legally and legitimately. Once Dave's Redistricting Tool is updated with the new New York numbers I will play with it to see what sort of district lines I think ought to be drawn. For now I simply started with county numbers and worked my way from Suffolk County west, north and west to Niagara.
Current New York Congressional Maps can be found here at govtrack.
A quick look at the make-up of our counties, population and potential congressional map:
| CD |
COUNTY (total county pop.) |
DISTRICT POPULATION BY COUNTY |
| 1 |
Suffolk (1,493,350) |
717,707 |
| 2 |
Suffolk |
717,707 |
| 3 |
Suffolk |
57,936 |
|
Nassau (1,339,532) |
659,771 |
| 4 |
Nassau |
679,761 |
|
Queens (2,230,722) |
37,946 |
| 5 |
Queens |
717,707 |
| 6 |
Queens |
717,707 |
| 7 |
Queens |
717,707 |
| 8 |
Queens |
39,655 |
|
Kings (2,504,700) |
678,052 |
| 9 |
Kings |
717,707 |
| 10 |
Kings |
717,707 |
| 11 |
Kings |
391,234 |
|
Richmond (468,730) |
326,473 |
| 12 |
Richmond |
142,257 |
|
New York (1,585,873) |
575,450 |
| 13 |
New York |
717,707 |
| 14 |
New York |
292,716 |
|
Bronx (1,385,108) |
424,991 |
| 15 |
Bronx |
717,707 |
| 16 |
Bronx |
242,410 |
|
Westchester (949,113) |
475,297 |
| 17 |
Westchester |
473,816 |
|
Rockland (311,687) |
243,891 |
| 18 |
Rockland |
67,796 |
|
Putnam (99,710) |
99,710 |
|
Orange (372,813) |
372,813 |
|
Dutchess (297,488) |
177,388 |
| 19 |
Dutchess |
120,100 |
|
Ulster (182,493) |
182,493 |
|
Sullivan (77,547) |
77,547 |
|
Columbia (63,096) |
63,096 |
|
Greene (49,221) |
49,221 |
|
Delaware (47,980) |
47,980 |
|
Rensselaer (159,429) |
159,429 |
|
Albany (304,204) |
17,841 |
| 20 |
Albany |
286,363 |
|
Schoharie (32,749) |
32,749 |
|
Schenectady (154,727) |
154,727 |
|
Otsego (62,259) |
62,259 |
|
Saratoga (219,607) |
181,609 |
| 21 |
Saratoga |
37,998 |
|
Montgomery (50,219) |
50,219 |
|
Fulton (55,531) |
55,531 |
|
Washington (63,216) |
63,216 |
|
Warren (65,707) |
65,707 |
|
Hamilton (4,836) |
4,836 |
|
Essex (39,370) |
39,370 |
|
Clinton (82,128) |
82,128 |
|
Franklin (51,599) |
51,599 |
|
St. Lawrence (111,944) |
111,944 |
|
Herkimer (64,519) |
64,519 |
|
Jefferson (116,229) |
90,640 |
| 22 |
Jefferson |
25,589 |
|
Lewis (27,087) |
27,087 |
|
Oswego (122,109) |
122,109 |
|
Oneida (234,878) |
234,878 |
|
Madison (73,442) |
73,442 |
|
Chenango (50,477) |
50,477 |
|
Broome (200,600) |
184,125 |
| 23 |
Broome |
16,475 |
|
Cortland (49,336) |
49,336 |
|
Onondaga (467,026) |
467,026 |
|
Tioga (51,125) |
51,125 |
|
Cayuga (80,026) |
80,026 |
|
Tompkins (101,564) |
53,719 |
| 24 |
Tompkins |
47,845 |
|
Chemung (88,830) |
88,830 |
|
Schuyler (18,343) |
18,343 |
|
Seneca (35,251) |
35,251 |
|
Wayne (93,772) |
93,772 |
|
Ontario (107,931) |
107,931 |
|
Yates (25,348) |
25,348 |
|
Steuben (98,990) |
98,990 |
|
Monroe (744,344) |
201,397 |
| 25 |
Monroe |
542,947 |
|
Livingston (65,393) |
65,393 |
|
Genesee (60,079) |
60,079 |
|
Orleans (42,883) |
42,883 |
|
Wyoming (42,155) |
6,405 |
| 26 |
Wyoming |
35,750 |
|
Allegany (48,946) |
48,946 |
|
Cattaraugus (80,317) |
80,317 |
|
Chautauqua (134,905) |
134,905 |
|
Erie (919,040) |
417,789 |
| 27 |
Erie |
501,251 |
|
Niagara (216,469) |
216,456 |
Sharp eyes will note the missing 13 people in Niagara County at the end of the table. New York's total population divided by 27 actually equals 717,707.48 people per district. Rather than deal with the half person per district I rounded thereby leaving 13 lost souls to head over the falls in a barrel.
I am not suggesting these are the districts we will end up with. I am not even proposing they are good ones or the right ones. It's just a quick pass at laying out the data and seeing what it shows us.
Later on, after a more thorough review of the data I'll take a crack at our State Senate Districts as well.

