I have been working on this for a while, but I waited until after the 2011 state elections to give a second set of PVI numbers. This map should get 20-27 seats for Democrats in the Senate.
Even though Kentucky is Republican at the federal level, it still is Democratic at the state level, one of the few southern states that this is still true. For an average number, I combined all of the 2007 state races (except Agriculture Comm. because the Democratic candidate was not even supported by his own party). This does include the barely credible Democratic candidate for Secretary of State which helps to balance the number, which is 55.8 D, 44.2 R. That is slightly more Democratic than I wanted, but that stands as the PVI number. In addition, some of the numbers for Democrats in Eastern Kentucky are so big, that it may skew the PVI a little bit in other places. However, I do not have access to precinct level data. So, I have had to make some guesses on Jefferson County based on more recent elections and party registration per precinct.
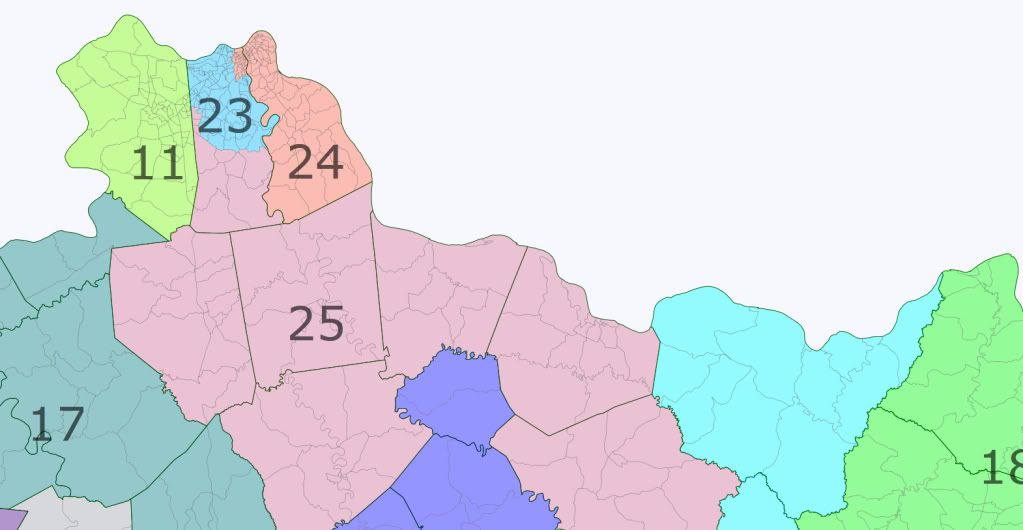
The problem is when you combine the Southern and Eastern Kentucky districts, they nearly combine to be one full Senate seat less in representation. My goals here were ambitious as well. Eliminate one Republican seat altogether, keep all Democratic incumbents in favorable districts, and cause the defeat of Republican Sen. Brandon Smith. I changed this districts several times to do this. This region also starts the brutal process of chopping Fayette County into six districts.
For 2011, the new number is D 53.2, R 46.8. All races are in this one. For the governor's race, Gatewood is simply ignored. There were big changes in the PVI in Southeastern Kentucky, where attacks on President Obama and coal have had their effect. Also, Western Kentucky shifted to the GOP, but it should be noted that two of their candidates (P'Pool and Johnson) were from Western Kentucky. This makes some of the seats in those regions make some big changes from being strong Democratic seats to being not so Democratic. However, Louisville and Lexington continued their shifts to Democrats. This map tries to give Democrats a chance at a maximum number of seats. It could be drawn to create less Democratic seats, but more safe ones, but it packs Republicans into as few of seats as possible. To be cautious, I moved several seats that are probably safe for Democrats in these regions as Likely Democrat.
For those of you that are not familiar with redistricting at the state level in Kentucky, the state places as much focus on keeping counties whole as population. The three big counties- Jefferson, Fayette, and Kenton have to be split. However, in order to keep the population differences from getting too bad, I did split Hopkins County in Western Kentucky. Had I been able to spilt counties, I could have drawn a Newport-Covington seat in Northern Kentucky to give the Democrats a better chance there, but the Kentucky Supreme Court would likely throw that out.
Eastern Kentucky

30. NEW SEAT, Cumberland Gap-Knott
2007: D 67.5, R 32.5, D+11.0
2011: R 53.9, D 46.1, R+7.1
This seat has two competitive counties (Bell, Harlan) and two heavily Democratic ones (Letcher, Knott). There is also one small Republican county (Leslie). The goal of this district was to destroy Brandon Smith's seat. He could move to an overlapping county and run here, but this seat clearly moved to the Democrats favor with these changes. This seat voted big for Bill Clinton, then for Al Gore. However, this seat took a sharp turn to the right in 2011, as did counties in the southeast corner of Kentucky. This was a massive swing of 18 points from D to R. I should note that the 2007 number was skewed, the losing Democrat- who lost badly statewide was from Pineville. This would be an interesting race. TOSSUP
27. Sen. Walter Blevins (D-Rowan) Morehead-River to the Mountains
2007: D 58.1, R 41.9, D+2.3
2011: D 60.4, R 39.6 D+7.2
This ten county monstrosity is designed along with to eliminate Brandon Smith and keep all Democratic incumbents in Eastern Kentucky in office. It has three Republican counties and seven Democratic ones. This seat, not in the southeast corner did not share the 2011 shift to the right that it did. This makes this seat Democratic. LIKELY DEMOCRATIC
31. Sen. Ray Jones (D-Pike), Pikeville-Paintsville
2007: D 62.3, R 37.7, D+6.5
2011: D 52.7, R 47.3, R+0.5
This seat stays the same except it adds Lawrence County to balance out the population. This seat also contains Butcher Hollow, where Loretta Lynn was born. No trouble for Jones here. Pike County moved from about 5 to 2 Democratic to about 3 to 2 Democratic, and Johnson and Martin Counties moved further to the GOP. This is another southeast Kentucky seat that turned strongly towards Republicans. Sen. Jones should be fine, but it remains to be seen for how long this stays Democratic. LIKELY DEMOCRATIC
29. Sen. Brandon Smith (R-Perry), and Sen. Johnny Ray Turner (D-Floyd), Prestonsburg-Hazard
2007: D 68.0, R 32.0, D+12.2
2011: D 57.0, R 43.0, D+4.8
This seat originally paired two Democrats under my plan, however, I managed to create this strange looking seat to get rid of Sen. Brandon Smith. While this seat does have heavily Republican Jackson and Owsley Counties, the rest of the district is very strongly Democratic. This is the third southeast Kentucky seat that has moved more than ten points away from Democrats. President Obama is very unpopular in this region, and Republicans constant attacks on the coal issue clearly had some effect, along with some other social issues, but 57% is still enough for a Democratic win. LIKELY DEMOCRATIC
18. Sen. Robin Webb (D-Carter), Ashland-Flatwoods
2007: D 63.5, R 36.5, D+7.7
2011: D 60.3, R 39.7, D+7.1
Robin Webb is a big winner here. She loses the western part of her old seat (including heavily Republican Lewis County) and gains Democratic Boyd County (Ashland). No trouble for her here. Billy Ray Cyrus was born here and his father Ron Cyrus served 20 years in the legislature from Greenup County. SAFE DEMOCRAT
28. Sen. R.J. Turner (D-Clark), Winchester-Bourbon-Lexington East
2007: D 56.9, R 43.1, D+1.1
2011: D 57.7, R 42.3, D+4.5
This district begins the multi-district process to eliminate the Forgy-Kerr seat. Less than 20% of this seat is Lexington, which extends some Democratic precincts north of downtown. The majority here is in Clark, Bourbon, and Nicholas Counties. My only reservation here is that a Democratic State House member lost in Clark County, and Ben Chandler lost here too. Even Palmer lost it. I do not know if it was a 2010 fluke here, but Turner should be fine here if he could hold in 2010 by a five point margin. I originally drew this seat south to take in Jackson and Estill Counties, but Jackson is so Republican, that it made the seat too close, so Palmer ended up with a similar seat to what he has now. LIKELY DEMOCRAT
Northern Kentucky
This is the first part of the "Golden Triangle" of Kentucky, which is Louisville, Lexington, Northern Kentucky and points in between. Because of population losses outside this region, a new seat had to be created somewhere. I made it a competitive district that is made up of parts of six old districts. My goal here was to create as decent of a chance for Democrats in the Northern Kenton seat, while making the other two seats outside of the Cincinnati orbit winnable for Democrats, and possibly eliminating Sen. Damon Thayer.
11. Sen. John Schickel (R-Boone), Florence-Hebron
2007: R 60.1, D 39.9, R+15.9
2011: R 63.7, D 36.3, R+16.9
There is not much to say here. The last major Democrat to win here was Ken Lucas, who was Judge-Executive in the 90s in Boone County. He did not even win his home county in any of his three terms in Congress. This was the largest district in the state after the Census, so this seat is entirely in Boone County. Boone is the strongest Republican county in the three county region of Northern Kentucky bordering Cincinnati, and is on par with some of the counties in Southern Kentucky for most Republican in the state. Rand Paul won 75% here. SAFE REPUBLICAN
23. Sen. Jack Westwood (R-Kenton), Kenton Northwest-Central
R 50.4, D 49.6, R+14.2
R 63.6, D 36.4, R+16.8
The ideal thing for Democrats would be to pair Covington and Newport. However, this seat cannot cross into Campbell County. That left two choices, Covington and Campbell or Northern Kenton. With population losses in Northern Kenton, it had to move further south. When I ran the numbers, it made more sense to link Covington with Campbell. This takes this seat out of play. SAFE REPUBLICAN
24. Sen. Kathy Kratz Stine (R-Campbell), Campbell-Covington
2007: R 54.1, D 46.9, R+3.9
2011: R 50.3, D 49.7, R+3.3
This seat drops Pendleton County and replaces Covington. This makes this seat much better for Democrats. The precincts added from Covington have a strong Democratic lean. Stine is in for a tougher battle, but she will still hold a big edge. LEAN REPUBLICAN
25. NEW SEAT, Cynthiana-Maysville
2007: D 55.5, R 45.5, R+0.3
2011: D 51.1, R 48.9, R+2.2
Don't fret too bad about this seat having Southern Kenton County, it is only about 15% of the vote here, and it is careful to exclude Independence, and I may have overestimated the Republican numbers there. However, while the rest of the counties here lean Democratic locally, they are not as strongly Democratic as the ones in southeastern part of the state. This is not a slam dunk. George Clooney's aunt Rosemary was born in Maysville, as was former Miss America Heather French Henry. Other than Southern Kenton, all other parts of the district have Democratic House members. Rep. Mike Denham (Mason) or Tom McKee (Harrison) could run strong here. Note: For the Kenton County section, I used a number I came up with after looking at relative party registration numbers for Kenton county. However, in the past four years, Grant and Pendleton Counties have moved to the GOP. They may be starting to pick up some suburban Cincinnati residents. This would be a competitive seat. TOSSUP
17. Sen. Damon Thayer (R-Scott), Georgetown-I-71 Center
2007: D 57.3, R 42.7, D+1.6
2011: D 56.3, R 43.7, D+3.1
Thayer gets a real shaft in this seat. It starts in Lexington, where about 15% of the district is and picks up several minority precincts in the north. Then about 45% is in Thayer's home in Scott County (Georgetown). The rest is in a very neglected part of the state, the rural counties in between the Louisville, Lexington, and Cincinnati areas. These are traditionally Democratic counties. When Ken Lucas represented the 4th district in Congress, all these counties voted for him, even in his failed comeback attempt in 2006. I was actually surprised when I looked at the numbers that this seat came out as Democrat as it did, but those I-71 counties are extremely Democratic, which offset Scott County. Thayer loses his heavily Republican precincts in Southern Kenton County in exchange for these. This will be a major test for Thayer in a district more than half new. State Rep. Rick Rand, who was in the State Senate, who is from Henry County could run strong here. LEAN DEMOCRAT
Lexington Metro Area
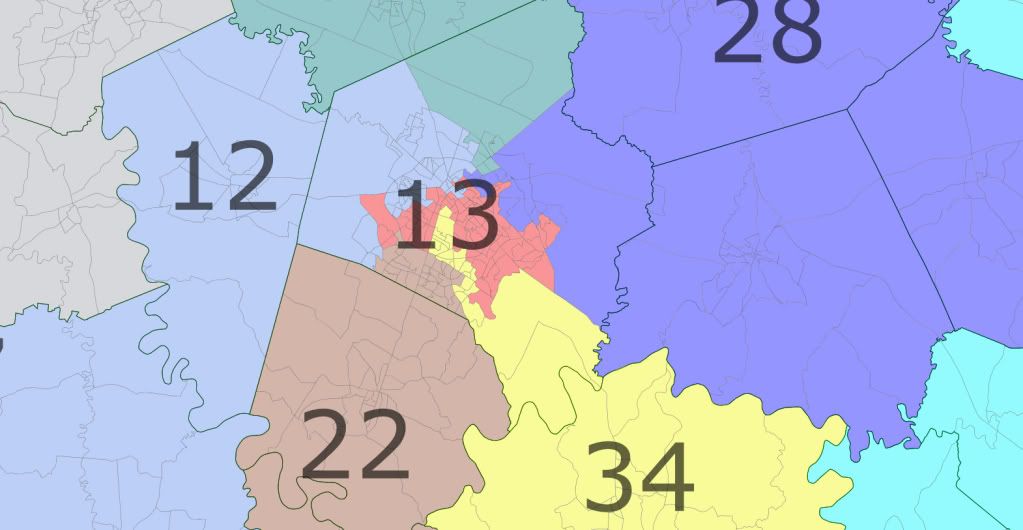
13. Sen. Katie Stein (D-Fayette), Lexington Center
2007: D 58.3, R 41.7, D+2.5
2011: D 63.2, R 36.8, D+10.0
This seat is horrible looking. It is not as Democratic as before, but still if safe. Instead of drawing two Democratic leaning Fayette County seats, I created one seat, and used the rest of the non-SD-7 precincts to strengthen Democrats in other seats and/or to fill in population. Most of the precincts voted for Jack Conway and Ben Chandler last year. Lexington has moved Democratic in the last four years and the overall Fayette number is skewed to the GOP given the Trey Grayson number and this being the home of two of the GOP nominees (Fletcher and Lee). There was K.C. Crosbie that run well in Fayette County, but her strongest precincts were in South Lexington, not as much here. While the Purchase and Eastern Kentucky have moved to the GOP, the Lexington area has taken a strong left turn. SAFE DEMOCRAT
22. Sen. Alice Forgy-Kerr (R-Fayette) and Sen. Tom Buford (R-Jessamine), Lexington South-Nicholasville
2007: R 58.6, D 41.4, R+14.4
2011: R 57.6, D 42.4, R+10.8
This is one of the biggest point of controversy in this map. I eliminate Alice-Forgy Kerr's seat, and there is only one seat completely in Fayette County. This seat takes in Nicholasville and the heavily Republican precincts in South Lexington. This would set up an interesting primary battle. Buford is actually an ally of Gov. Beshear on the issue of casino gambling and Forgy-Kerr is a weak incumbent. SAFE REPUBLICAN
12. NEW SEAT, Lexington West-Harrodsburg-Woodford
2007: D 56.8, R 43.2, D+1.0
2011: D 58.5, R 41.5, D+5.3
This is a deceptive looking seat. Nearly 60% of the seat is in Fayette County, and those precincts are mostly Democratic-friendly, including a few African American areas in Lexington. The seat is 16% black. In the remaining counties, Versailles voted for Chandler and Mercer did not. This seat should go Democratic, but it is not a sure thing. This is one of the Lexington area seats where Trey Grayson's number was way out of line with the district and skewed the numbers. LIKELY DEMOCRAT
7. Sen. Julian Carroll (D-Franklin), Frankfort-Danville
2007: D 61.8, R 38.2, D+6.0
2011: D 61.5, R 38.5, D+8.2
A little less than half of this seat is in Frankfort, the State Capital and Democratic stronghold. It wraps down to Boyle County, home of Center College. The counties outside of Franklin are swing counties at the state level and strongly Democratic locally. Even if a Republican carried all of them, they would likely not get enough of a margin to overtake the Democratic margin in Frankfort, which is bolstered by the fact that Franklin County is an extremely high turnout county. Case in point- Jack Conway won only in Franklin County and won this district. SAFE DEMOCRAT
34. Sen. Jared Carpenter (R-Madison) Richmond-Berea-Lexington Downtown-Rupp
2007: D 52.5, R 47.5, R+3.3
2011: D 55.4, R 44.6, D+2.2
This district looks gerrymandered, but it makes sense. It connects Berea College, Eastern Kentucky University in Madison County to the University of Kentucky in Lexington. This also takes away heavily Republican Lincoln and Rockcastle Counties and replace them with downtown Lexington. Democrats lost this open seat big last year in the GOP tide after only lightly contesting it. This changes the equation for the next race. This seat is now up in the air. TOSSUP
Central Kentucky in the Louisville Metro Area
26. Sen. Julie Denton (R-Jefferson) and Sen. Ernie Harris (R-Oldham), Oldham-East Louisville
This seat has 11 country clubs. This has some of the wealthiest areas of Louisville and extends into Oldham County, which voted for Fletcher in 2007. This sets up a primary battle with Denton and Harris. The majority of this seat is in Oldham County, which should benefit Harris. However, Denton is a proven fundraiser. Denton could also move to one of the open seats in Jefferson County, but they would be a fight in the fall. SAFE REPUBLICAN
20. Sen. Paul Hornback (R-Shelby), Bullitt-Shelby
2007: D 52.8, R 47.2, R+3.0
2011: R 50.0, D 50.0, R+3.2
This district had about 19,000 too many people before. In trying to figure out where to put these counties, I originally had three seats jetting into the Republican precincts in Jefferson County, one for Oldham, Bullitt, and Spencer/Shelby. Then, I found that a small land bridge through Jefferson could link Bullitt and Shelby Counties, and Spencer County could go elsewhere. This is how I was able to create six potential Democratic seats in Jefferson County. Both counties here have been moving more to the GOP side as they have had suburban growth. That is not likely to change. With so many other opportunities for Democrats elsewhere, Hornback should be fine, unless this seat becomes a Bullitt/Shelby County fight, which Shelby would lose population wise. But, remember, this is not Oldham County, Democrats could still pull out an upset here. LIKELY REPUBLICAN
10. Sen. Dennis Parrett (D-Hardin), Radcliff-Elizabethtown
2007: D 50.1, R 49.9, R+5.7
2011: D 52.6, R 47.4, R+0.6
One of the biggest surprises on election night was the win of Dennis Parrett over Elizabeth Tori in Hardin County. Democrats had targeted her since they lost the seat in 1994 with little success. However, Parrett is not completely safe here. This district takes in less of Jefferson County than it did before and follows further up river as to get a few Democratic precincts. These new Jefferson precincts are important, because Hardin County actually had a net GOP vote in 2007, but this is a low turnout area in off year elections. But if Parrett can knock off an incumbent member in 2010, he must be doing something right. Republicans will likely look to Judge Executive Harry Barry or St. Rep. Tim Moore to take on Parrett. LEAN DEMOCRAT
14. Sen. Jimmy Higdon (R-Marion), Bardstown-Campbellsville
2007: D 56.3, R 43.7, D+0.5
2011: D 57.9, R 42.1, D+4.7
The problem here is two-fold, Higdon is very popular in the strongest Democratic county in the district, and where to put Taylor County, which was a Fletcher county. Unfortunately, it ended up here. This seat is also the most Catholic seat in the state. In fact, the Diocese of Bardstown (now in Louisville), was created in 1808, along with Boston, New York, and Philadelphia. Gov. Beshear appointed Sen. Dan Kelly to a judgeship last year to pick up another Senate seat, but Higdon won it fairly easily. My version drops Mercer and Washington Counties, and gains Spencer (the fastest growing county in the state and an R+6 county) and Larue (Birthplace of Abraham Lincoln) Counties. As long as Higdon is here, he is safe. Once he leaves, it will be competitive, with a slight Democratic lean. The Democratic key here is Marion County, it was Steve Beshear's best county in 2011 along with Elliott County. However, it is also Higdon's hometown, where he is popular. As long as he is here, it stays GOP. SAFE REPUBLICAN, TOSSUP without Higdon
Southern Kentucky
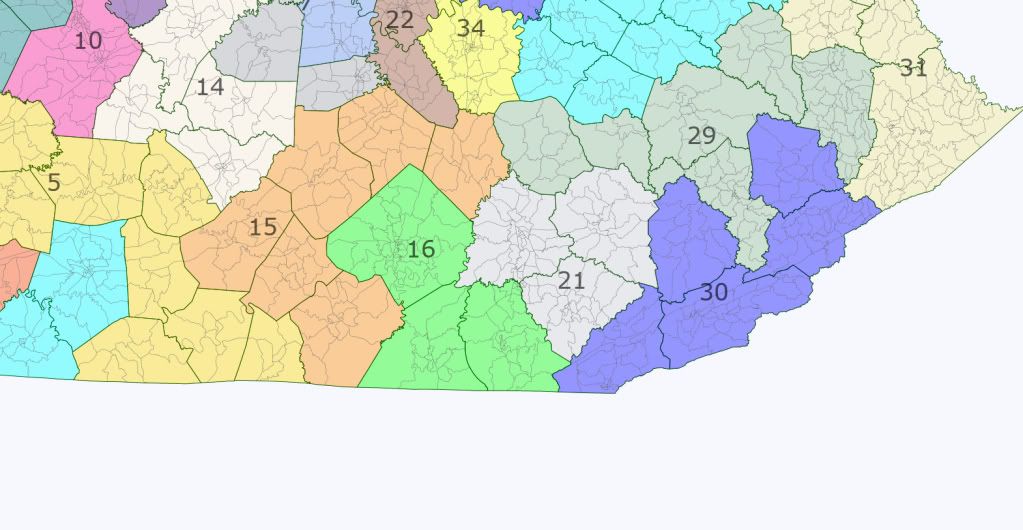
These are the most Republican counties in Kentucky. My goal here was to compact Republicans into as few seats as possible, and not allow Democratic counties to be diluted. This is where the seat that was moved came from.
21. Sen. Robert Stivers (R-Clay) and Tom Jensen (R-Laurel), London-Clay
2007: R 61.8, D 38.2, R+17.6
2011: R 62.7, D 37.3, R+15.9
The GOP gerrymander of these north/south districts ends for them, but begins for the Democrats. However, the result is that two Republicans get paired. Stivers is the #2 Republican, but Jensen has the population base in London. Interesting primary fight, but no contest in the fall. Harlan Sanders first started selling chicken in North Corbin, in Laurel County. SAFE REPUBLICAN
16. NEW SEAT, Somerset-Daniel Boone
2007: R 63.8, D 36.2, R+19.6
2011: R 63.7, D 36.3, R+16.9
This Somerset based seat is without an incumbent. In terms of party registration and voting, it is the strongest Republican seat in the state. The lawsuits that went to the Supreme Court on posting of the Ten Commandments in public buildings arose from Pulaski and Whitley Counties, in this district. SAFE REPUBLICAN
15. Sen. Vernie McGaha (R-Russell), Lake Cumberland-Highway 127
2007: R 61.2, D 38.8, R+17.0
2011: R 58.3, D 41.7, R+11.5
Instead of a district based in Somerset, McGaha gets a rural district that wraps around it. But still, McGaha represented three of these six counties before (Adair, Casey, Russell). This is a heavy GOP seat where Fletcher won every county. McGaha is thinking about retirement, so David Williams could move here to avoid a contest with other incumbents. SAFE REPUBLICAN
5. Sen. David Williams (R-Cumberland), Sen. Carroll Gibson (R-Grayson), and Sen. David Givens (R-Green), Leitchfield-Caves-Cumberland
2007: R 57.2, D 43.8, R+12.0
2011: R 61.0, D 39.0, R+14.2
When you can put three incumbents in one district, it means one of two things: (1) the map was heavily gerrymandered before or (2) the new map is heavily gerrymandered. Here it is both. This district has a whopping nine counties, all of which lean Republican to some degree or another. Six of them voted for Ernie Fletcher in 2007. It is a GOP vote sink for this area. The population is fragmented here. One of the incumbents is Senate President David Williams, who would have a big money edge, but no one of these three has a majority of the new territory here. In fact, Williams has three counties from his old seat, Givens three, and Gibson two, but Gibson has the most voters. SAFE REPUBLICAN
Western Kentucky
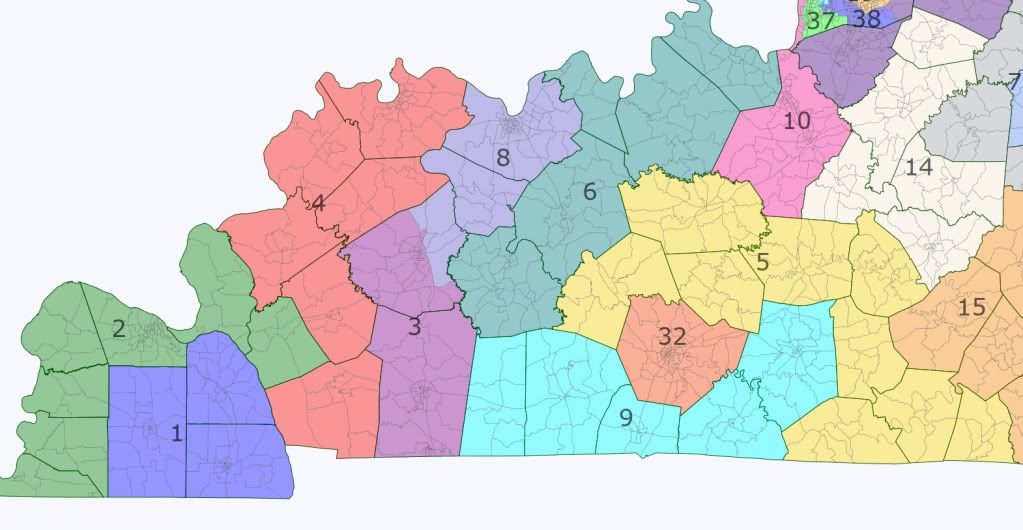
My goal here was to account for population losses and to make sure that as few competitive and Democratic counties were wasted as possible. This meant there is a new seat here along the border with Tennessee. The Purchase Counties are shifted to make things more difficult for the GOP incumbents there.
32. Sen. Mike Wilson (R-Warren), Bowling Green-Warren
2007: D 50.7, R 49.3, R+5.1
2011: R 53.2, D 46.8, R+6.4
Warren County always needed another county to make a Senate district. In the 1990s, it was Democratic Logan County, but then Republicans made it uber-GOP Butler County. Sen. Nick Kafoglis retired in 2002, and it was won by now Congressman Brett Guthrie. Then Democrat Jim Reynolds won the seat in a 2009 special election. However, he was swept up in the GOP tide last year (this is adopted home of Sen. Rand Paul, who won here big), losing both counties. Since Bowling Green made big population gains, Warren County will be its own district. This is likely to be very competitive. I know some of you all may think that Bowling Green is a Democratic leaning area because of Western Kentucky University. However, the county has trended Republican for a long time, but its long term trend is not certain. TOSSUP
9. NEW SEAT, Russellville-Glasgow
2007: D 51.2, R 48.8, R+4.6
2011: R 52.8, D 47.2, R+6.0
This seat is without an incumbent and centered population wise on Glasgow and Russellville. It has one county (Allen), that voted for Fletcher. Every county has a Democratic State House member. It is also the birthplace of Jefferson Davis. Rep. Johnny Bell or Wilson Stone could win here, but Democrats would stand to possibly lose their House seats. Though not geographically possible, I wish this district could subtract Allen County and add Hart County, which is competitive and wasted in SD-5.This is a winnable district for Democrats, but not an easy seat to win. A lot would depend on the candidates. I am afraid Bill Johnson would try to run here for the GOP. TOSSUP
6. Sen. Jerry Rhoads (D-Muhlenberg), Brandenburg-Greenville
2007: D 60.1, R 39.9, D+4.3
2011: D 57.2, R 42.8, D+4.0
Jerry Rhoads gets a very different district than before. He keeps his heavily Democratic base in Muhlenberg County, but his district extends to Meade County. One of the reasons I did this is that Western Kentucky is not growing much, and Meade, Hancock and Breckenridge Counties were diluted into Carroll Gibson's district. And Meade County is the closest county in the state to the overall statewide average. SAFE DEMOCRAT
8. Sen. Joe Bowen (R-Daviess), Owensboro-Daviess
2007: D 62.0, R 38.0, D+6.2
2011: D 53.8, R 46.2, D+0.6
This race was the victim of the GOP landslide of 2010. Owensboro is the home of former Sen. Wendell Ford. David Boswell should not have lost here, and some of that may directly relate to Boswell himself, who underperformed here in 2002, when he had opposition last time for the Senate, but I would note he won Daviess County big in his race for Congress. There may have been some negatives that rubbed off on him from that race as well. This district more or less stays the same, except it adds a few precincts in Hopkins County. In every model of Western Kentucky, one of the medium size counties has to be split to keep the population deviation to an acceptable level. Bowen was a one term House member from Owensboro, elected in 2004, then lost in 2006. It seems that tides wash Bowen in and then wash him out. He should be a top Democrat target. LEAN DEMOCRAT
4. Sen. Dorsey Ridley (D-Henderson), Henderson-Pennyrile
2007: D 63.8, R 36.2, D+8.0
2011: D 55.9, R 44.1, D+2.7
Sen. Ridley had no opponent in this Democratic district centered in Henderson. It loses Livingston and Caldwell Counties and gains Trigg County. This does not change the partisan makeup that this is a very Democratic district at the local level. SAFE DEMOCRAT
3. Sen. Joey Pendleton (D-Christian), Hopkinsville-Madisonville
2007: D 56.6, R 43.4, D+0.8
2011: D 50.3, R 49.7, R+2.9
Joey Pendleton's district trades Logan and Todd Counties for most of Hopkins County. Most of the people here are still in Christian County though. Pendleton has shown a lot of tenacity holding on here. I worry some about the Madisonville part of this district. It elected Todd P'Pool and they elected a new GOP member to the State House last year. Hopkinsville is Democratic at the local level, but turning out the black community there is a persistent problem for Democrats in mid-term elections. A good case was in 2006 when Democrats lost an open House seat where it had the lowest turnout of any district in Kentucky. In 2007, Christian County turned out at only 23%, in 2011, it was only 17%. LEAN DEMOCRAT
2. Sen. Bob Leeper (I/R-McCracken), Paducah-Purchase West
2007: D 59.6, R 40.4, D+3.8
2011: R 50.2, D 49.8, R+3.4
Sen. Leeper has five new counties to run in under this map. Leeper's worst county was Marshall, which has been moved to the 2nd district to weaken Sen. Winters. Democrats ran a strong candidate in Rex Smith last year, but he was swamped by the GOP tide, losing by 3%. A Democrat that can only lose the Paducah area to Leeper should be able to win the other counties by a large enough margin to defeat Leeper, especially if there is an actual Republican running in the race. Despite it being in the Purchase, Paducah is not nearly as Democratic as the rest of the counties. It has an even PVI here. By the way, the reason that Leeper is an Independent, rather than a Republican is that in 2005, Senate President Williams seated Dana Seum-Stephenson to a Senate seat after she had been declared to have not met Kentucky's residency standards. Williams ignored the law and even went as far as to say that the Senate could seat someone below the age of 25 (the minimum age under the Kentucky Constitution) and no court could review that. The Supreme Court disagreed. One of the two dissenters of that opinion is still on the Court: Will T. Scott, who needs to be defeated for his 2nd term in 2012. Leeper was disgusted and dropped his GOP affiliation (and nearly resigned), but is still basically a Republican, who was brought back into the fold by being made Appropriations Chairman. Leeper may be the only person that has won the same legislative seat as a Democrat, Republican, and Independent that I know of. This seat took a sharp turn to the GOP in 2011. The biggest change was in McCracken County (Paducah), which was the only county in this district with a net GOP number, but it outweighed the other small counties. Still, with Leeper, there is a three way race, so a chance for Democrats to win with less than a majority. TOSSUP
1. Sen. Ken Winters (R-Calloway), Mayfield-Murray
2007: D 61.1, R 38.9, D+5.3
2011: D 50.7, R 49.3, R+2.5
Ken Winters is the oldest member of the Senate which leads to retirement rumors. This becomes a much more compact district in Calloway, Marshall, and Graves County. The Fancy Farm picnic is held every year here in Graves County. The problem for Democrats here is Carroll Hubbard, the former Congressman, who has managed to loses both Purchase seats for Democrats. Could it be he went to federal prison hurting him? Hubbard is making noise about running again, which makes Winters running again more likely. Winters is from Calloway County where he was Murray State University President. In anticipating Hubbard, the only county in the Purchase he won big was Marshall against Sen. Leeper, so I decided to switch it to this seat. I am making this prediction on the basis that Hubbard will not be the Democratic nominee (if he is it is LEAN REPUBLICAN). Rep. Fred Nesler or Rep. Melvin Henley could win here, and there is a deep bench of Democratic talent here locally. TOSSUP
Jefferson County
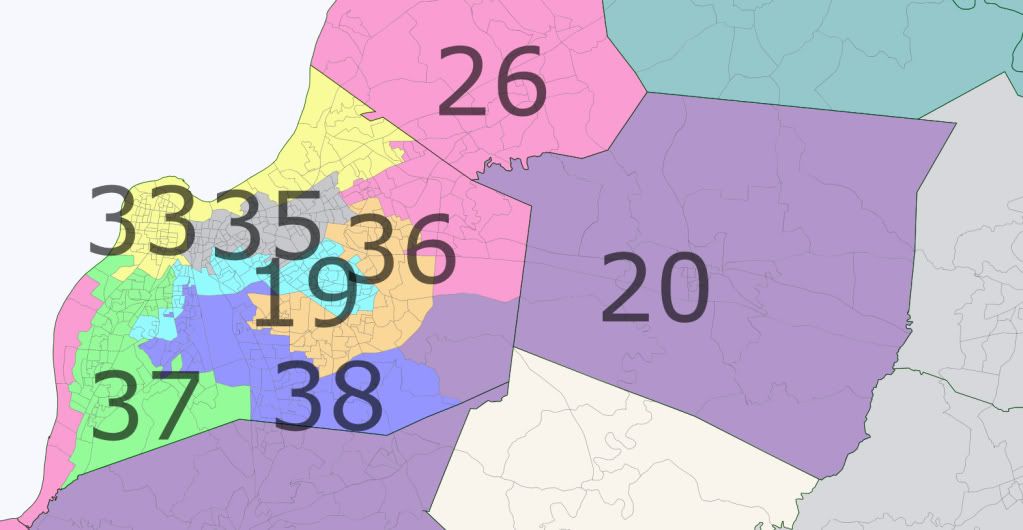
As for Louisville, there are several areas that need a little description, as they do not show up on DRA
All of Jefferson County- D 62.6, R 37.4, D+9.4
23.2% of all Dem votes, 15.7% of all GOP votes
West End- North of Algonquin Parkway, west of 9th Street (for some people 7th Street)
South End- East of I-65, south of Eastern Parkway, west of Bardstown Road
East End- East of Bardstown Road
Old Louisville- Between Broadway and the University of Louisville
36. NEW SEAT, Louisville-Newburgh-Gene Snyder East
This reverse C shaped district starts in the heavily black area of Newburg, which is also strongly Democratic. Then it moves south to Democratic leaning Fern Creek, before it moves north along the Gene Snyder Freeway to the Republican Douglas Hills area along North Hurstbourne Parkway. This makes for an 19% black district. A Democrat could possibly have trouble in a wave year, but this should be a Democratic seat in 9 out of 10 elections. LIKELY DEMOCRAT
38. NEW SEAT, Louisville-Airport-Okolona-South County
This district is very ugly. It starts around Churchill Downs, moves to Okolona, and areas around the Airport. These areas are Democratic. Then it takes in Republican precincts south of the Gene Snyder Freeway. The Democratic areas should outweigh the GOP ones, but not by a whole lot. More people here have a Democratic Metro Council member than a Republican one. Dan Seum could move here and run, where he would run better than where he lives. LEAN DEMOCRAT
19. Sen. Tim Shaunessy (D-Jefferson), Louisville-Churchill Downs-Buechel-Jeffersontown
This seat is extremely ugly, and I made it even more ugly to strengthen the Airport-Okolona seat. It starts near Iroquois Park (Lean GOP), to the South End of Louisville and Churchill Downs (strong Democrat), past Poplar Level Road and Buechel (strong Democrat), before crossing the Watterson Expressway to take in the Hurstbourne South area and part of Jeffersontown (slight lean GOP). Shaunessy actually lives on the far east part of this seat, so he already has some of the eastern part of the seat. SAFE DEMOCRAT
35. Sen. Denise Harper-Angel (D-Jefferson), Louisville-Downtown-St. Matthews
Sen. Harper-Angel's district starts in Old Louisville (solid Democrat and very liberal), moves to the East End (historically Republican, but now Democratic leaning), to St. Matthews (historically Republican, but now competitive), and onto Lyndon (heavily Republican). This district has Cave Hill Cemetery, where Zachary Taylor and Col. Sanders are buried. SAFE DEMOCRAT
37. Sen. Perry Clark (D-Jefferson) and Sen. Dan Seum (R-Jefferson), Louisville-Shively-Dixie Highway-Fairdale
This seat pairs Perry Clark and Dan Seum, who switched parties about ten years ago. The bulk of the population here is in the Democratic areas of Shively, Pleasure Ridge Park (PRP), and St. Dennis. Also here is GOP leaning Valley Station and Republican areas along the Bullitt County line like Seum's home in Fairdale. I could see Seum moving to the new open SD-38. Seum is well-known in this area, so this is not a slam dunk, but this seat is Democratic. LIKELY DEMOCRAT
33. Sen. Gerald Neal (D-Jefferson), Louisville-West End to Prospect
Sen. Neal gets a district that runs along the river starting in the heavily black West End, moving to downtown, then all the way to the Oldham County line. It is about 51% black, a drop from what it is now, but still heavily Democratic. This district matches some of the wealthiest areas in Louisville with some of the poorest. SAFE DEMOCRAT
Bottom Line:
Safe D (8): 4, 6, 7, 13, 18, 19, 33, 35
Likely D (7): 12, 27, 28, 29, 31, 36, 37
Lean D (5): 3, 8, 10, 17, 38
Tossup (7): 1, 2, 9, 25, 30, 32, 34
Lean R (1): 24,
Likely R (1): 20
Safe R (9): 5, 11, 14, 15, 16, 21, 22, 23, 26
