We've all seen the "Pelosi Chart" comparing unemployment accross recessions. Well, that is just one graph of what is going on. I'm not an economist, but I know my way around excel and make a career of studying data. So, I went to the source (BLS & BEA) and threw a few extra charts together. You might want to see these.
First I'll start with the unemployment graph. Might as well start on familiar ground. Here is my recreation of it from BLS data using seasonally adjusted non-farm employment:
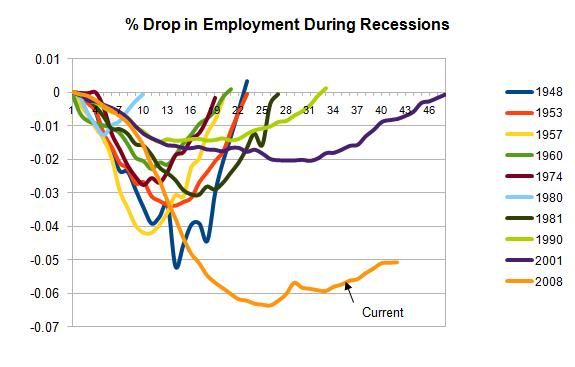
Yup, looks horrid any way you slice it. But check this graph out:
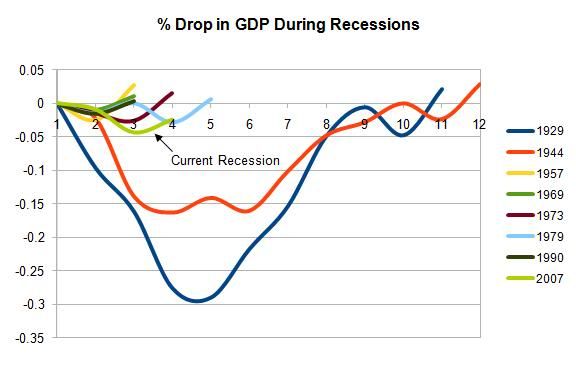
The unemployment graph shows percent drop in employment from its most recent peak. This is similar plot, comparing change in GDP from its most recent peak. This plot includes the Great Depression as well as the recession of the late fourties. The GDP swings don't quite line up with the unemployment swings. But, it is hard to say this recession is like the great depression, after all where is the drop in national income...??? (We know the answer to that, save it for the end - there is more to see...)
Next up is probably one of the saddest charts if you think about it for too long:
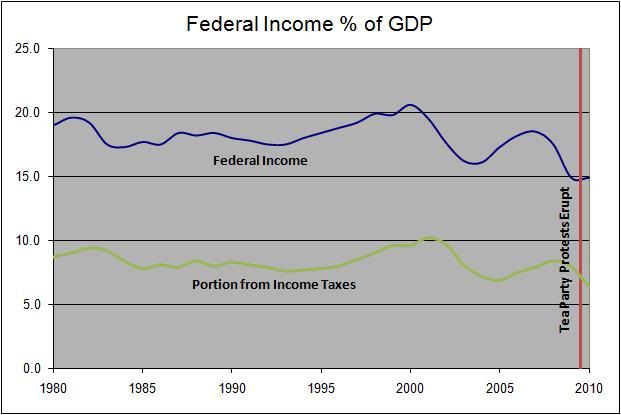
This shart shows federal income as a portion of GDP. I've thrown in a red line that denotes the start of the tea party tax protest movement. To think that people can be so easily manipulated into tax protests co-incidental to tax levels being their lowest in a 1/2 century is truly depressing if you think about it for too long. You have to go back to the 40s to find something lower.
Last one for now:
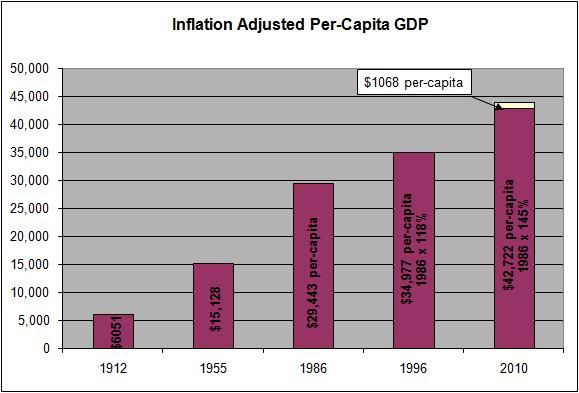
This is inflation-adjusted per-capita national income at various points in history. I picked: 1912 because "a dollar in 1912 should be worth a dollar today"; 1955 because those were happy days; 1986 was when I graduated high school; 1996 for a Clinton reference, and 2010 for where we are now.
Remember, this is inflation-adjusted, so no whining about fed monetary policy. And this is per-capita, so no whining about immigrants. Look how much better off we are than when Reagan was in charge! To the person we are 44% wealthier! The only difference in national income between Great Recession and No Great Recession is that teeny tiny little white box.
So, what do I make of this? Our problem is distribution - money is being hoarded at the top. The financial crisis is a fiction and a simple opportunity to not pay back the social security funds distributed by Bush as tax cuts to the wealthy. They have our money and they don't want to pay it back. The money is there, if 45% better off than under golden boy super hero ronnie the saint aint good enough, then what is?

