This diary is to identify what success looks like for Obama for America in Arizona over the next few months in terms of voter registration, and what it takes to build a winning coalition. Can Arizona become a great Democratic State like it was when Carl Hayden was in the US Senate ?
OBAMA FOR AMERICA - PATH TO 270
Okay you should all remember Jim Messina's update, but for those who don't the "Expansion Path" involves registering "100,000+ Voters" (he actually says hundred of thousands of new voters to put the State on the table):
Between March and April the number of Registered Democrats increased by 1,958 voters... at this rate we might get 10,000 extra registered Democrats for the next election... but not an extra 100,000. April 2012 has also seen the share of Registered Democrats drop to a historic low of 30%. Ken Bennett, who is the Arizona Secretary of State (Who oversees voter registration) has kindly offered to chair the Romney campaign in Arizona. More on that later, but as you have no doubt heard, Ken has paid homage to the birthers and requested a copy of President Obama's birth certificate... to the Romney campaigns dismay... But given Arizona's unfortunate choice of Secretary of State to also be next in line of succession after Governor it is a position likely to be held by an extreme partisan.
ARIZONA POPULATION
Arizona has always been a growing state, constantly gaining in population due to increases in the Sun Corridor (Phoenix - Tucson). The state is also famous for Hispanic growth and for regular appearances by snowbirds in winter time. It surpassed Nevada to be the fastest growing state in the nation. The graphs below start from when Arizona was a territory, with data from Wikipedia.
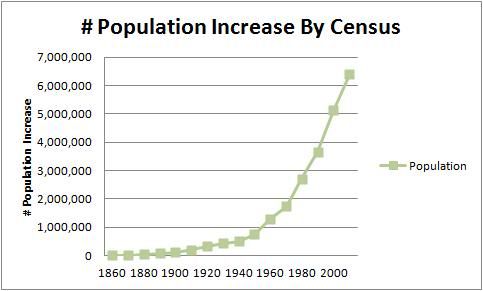
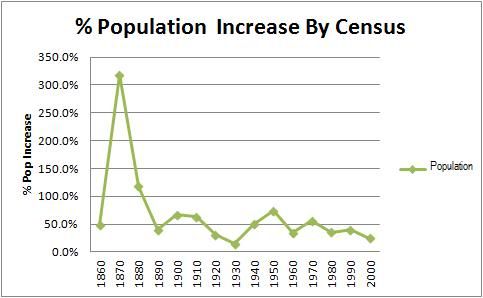
So with such constant growth in population, you would expect there to be constant growth in the number of registered voters...
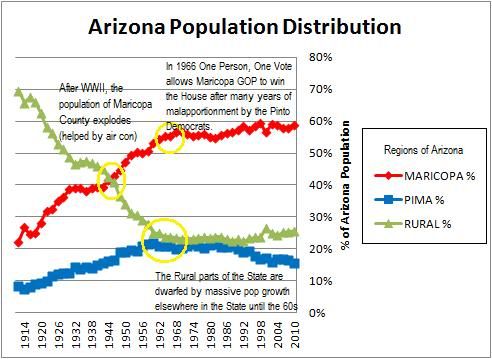
So how has Arizona grown ? Well after World War Two, the population of Greater Phoenix grew rapidly, helped by an influx of snowbirds and the creation of air conditioning. The rural Pinto Democrats ruled Arizona through malapportionment even after they lost the majority of overall voters (they stuck strictly to electing candidates based on county lines despite two counties holding the bulk of the population). In 1966 when One Person, One Vote was reinforced, the Suburban Republicans stormed the State House overthrowing the Pintos. In 1978 they did the same in the State Senate again winning through a massive advantage in Maricopa County. So perhaps Carl Hayden was the architect of destruction for his own party - a victim of his own success in bringing large public projects to Arizona. In modern times, growing Pima County is not growing as fast as the regional areas and Maricopa County.
HISTORIC PARTY REGISTRATION
The number of registered voters has steadily increased...but in recent years the numbers have often plateaued...due to purges of voter roles of "inactive voters". This neat little trick has the effect of greatly restricting overall voter registrations, and particularly Democrats. Republicans also are only increasing slowly, but Independent voters are still making reasonable gains.
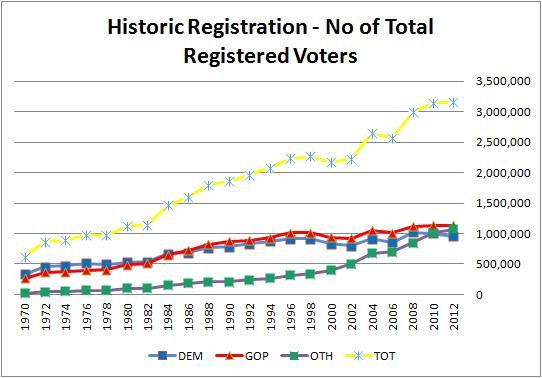
As you can see in the lead up to the 2008 Election the Democratic Voter Registration reversed the previous inexorable decline and increased by 168,024 voters, far more than the increase in the number of GOP and independent voters. This reduced the gap between Dems and GOP voter registration to just 96,335, the first time since 1994 that the deficit was below a 100,000 voters.
Despite Arizona being a conservative state, the Republican Party has in fact never had a majority of voters in Arizona. This is because after the Democratic Party lost the majority of registrations, changes in voter registration meant that registered Independents greatly increased at a great rate, before the Republicans could claim an outright majority. This was due to a 1998 ballot initiative which allowed Registered Independent voters be able to vote in either the Democratic or Republican Primary. Over 12 years from 1998 until 2010 the % of Independents exploded going from 15% to 32%. Prior to this, Independents had slowly grown over 32 years from 2% to 15% from 1966 to 1998. In fact by 2010, the number of Registered Independent Voters surpassed the number of Registered Democrats.
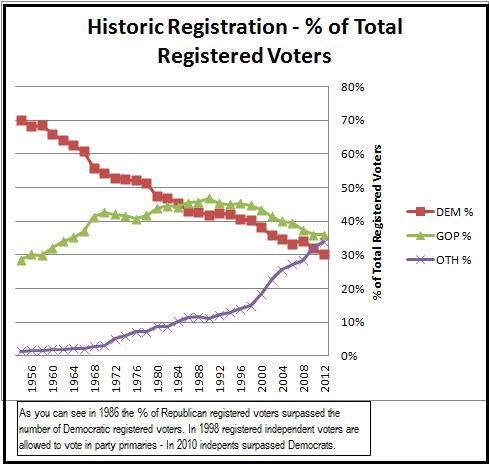
So as you can see, in 2012 the Dems have hit a historic low in share of registered voters having just 30%.
In terms of the actual gap in the number of registered voters, as of March 2012 it was 181,187. So it is not inconceivable that that gap could be overcome with a large push, particularly if similar GOP efforts are lacking. Either way the large amounts of registered independents makes a true win by OFA hard to determine. Obviously, the perception is that far more of the Independents are Conservative (anecdotal feedback is that in some areas they are more conservative). We want to seem more registered Democrats... but in many areas I suppose people might choose to be Independents just in case.
Please refer to the tables below the fold for further details on voter registration numbers if you are interested. (Note: Throughout this diary I use the Other category which is mostly independents but includes the tiny numbers of other parties such as Libertarians and Greens).
2012 PARTY REGISTRATION
So with Obama for America aiming to register 100,000+ voters how much of an increase in voter registrations have occurred ? Well according to the most recent statistics released by Arizona, total voter registration has barely increased from 2010 to April 2012 has barely increased. And the Democrats have slumped to a historic low (by % of total registrations). In fact, since the 2008 election, 72,000 Registered Democrat voters have vanished from the active voter rolls.
So what is a victory of OFA in Arizona Registration ? Well how about getting the inactive voters back on the rolls... and bring the Democrats up to have the highest number of registrations. The current voter registration gap between the Dems and GOP registered voters as of April 2012 is 182,417. Getting the 100,000 new voters registered and getting the 72,000 inactive voters back on the rolls would be a good win (well presumably more than that given new Dems would be registered at the same time inactive ones were being purged). Registering enough Democrats to surpass Independents once more is a start, surpassing Republicans is a definite win, and seemingly realistic (although presumably they will lift their efforts also).
2012 PARTY REGISTRATION - BY LD
A comparison of the Dem registration stats for each Legislative District that the Independent Redistricting Commission and the April 2012 data, the % of registered Democrats has decreased in every district. The same comparison for the Republican registered voters shows that they have increased their % voter registration in almost every seat.
(Note: The IRC stats only give percentages and do not seem to provide the date that they were taken. I presume they are 2010, but the official stats on the SOS website are only by the old LDs, with April 2012 the first numbers done under the new LDs.)
The % of Dem voters in the 15 most Red Legislative Districts has decreased by 0.72%, and in the 15 most Blue Legislative Districts has decreased by 0.76% Registered Voters.
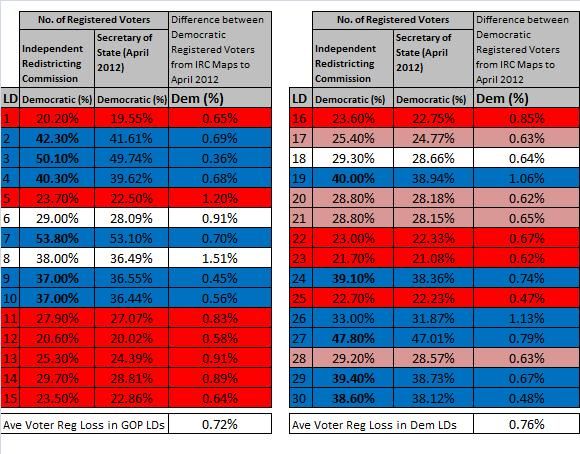
(Note: The colours I have used are from my previous diaries on the Legislative Districts. Dark Blue means a Democratic District, White means a competitive seat, Pink means a Republican Leaning District, and Red means a Strongly Republican District.
The % of GOP voters in the 15 most Red Legislative Districts has increased by 0.49%, and in the 15 most Blue Legislative Districts has increased by 0.43% Registered Voters. (Note: The way I did the spreadsheet effectively created a double negative - so those LDs with % with a - sign in front actually gained in GOP registered voters. The few that don't lost population.
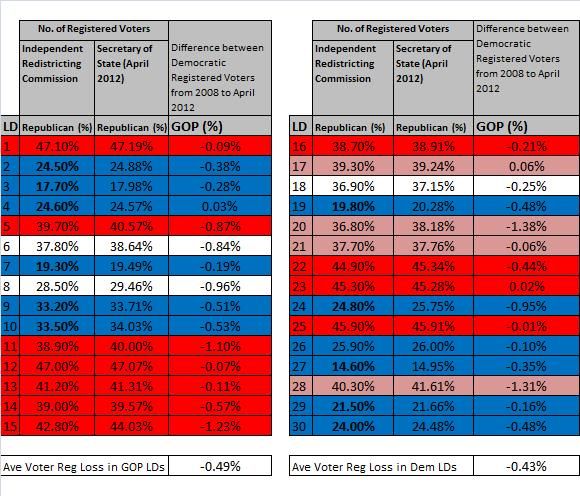
So as you can see the Dems lost Registered Voters across the board, whereas the GOP gained in almost all districts.
When the April 2012 numbers originally came out I was hoping to see big increases in some of the Hispanic districts in Glendale and Phoenix...
There are routinely stories now that talk about decreases in voter registration, such as here, and here..
WHAT DOES A WINNING COALITION LOOK LIKE ?
NOTE: This section had to become a diary in its own right so I cut it. Long story short - Dems finally lost the State Senate in 1978. The backbone for the Democratic Party between 1974 (at least) and 1990 when they finally won back the State Senate was the Pinto Democrats. After losing the State Senate in 1992 the number of rural seats held by the Dems shrank, with even rural seats drowned out by suburban growth in their regional centres. The Democratic coalition was Tucson/Phoenix based Urban Liberal and Hispanic seats, along with a Navajo Nation seat and a dwindling number of rural seats mostly with large Hispanic minorities (all of this last type were lost after the 2010 election). Since one person, one vote was enforced for the 1966 election, the Dems haven't held the house. They have held the State Senate at various times, from at least 1974 (if not earlier) until 1978, 1990-1992, and 2000-2002. On all these occasion the Dems only cobbled together a very shaky coalition that relied on Democratic State Senators in suburban Greater Phoenix seats where the House Reps were Republican. Going forward, it is vital that the Dems expand the playing field in Greater Phoenix...
WHERE ARE THE OPPORTUNITIES FOR OFA ?
So OFA wants to register Democratic voters, and particularly Hispanic voters who are growing as a share of the Arizona population as a whole. This is because Hispanics in Arizona tend to vote Democratic in large numbers, are often attacked by Republicans and unlike neighboring states like Nevada and New Mexico there are no prominent Statewide elected Hispanic Republicans. The Arizona Legislature has one Hispanic Republican in Steve Montenegro, but he is far from the candidate of choice for Hispanic voters in his district.
In 2010, the American Community Survey found that Hispanic Population of Arizona is 1,908,914, which is around 29.8% of the total Arizona population of 6,413,737. This compares to a 2005 Hispanic pop percentage of 28.8% and a 2000 Hispanic pop percentage 25.53%. So such a growing community is clearly one we need to target.
And President Obama has shown that they do consider the Hispanic Vote to be essential in the upcoming elections. Now it may be that they are mainly courting the Hispanic vote to ensure that they still win states that they won last time - eg. Nevada, Colorado, New Mexico (and even North Carolina). But it is clear that at the very least Arizona is still a stretch target, if not a plan B of some kind. If nothing else they are at least trying to find out how much of an advantage McCain was last time.
So where is the there potential gain for OFA ? If large numbers of Hispanic voters are either too young or not citizens where are the eligible voters that OFA could turn into Registered Voters ?
Pew Hispanic Center 2008 Review of the American Community Survey - Hispanics in Arizona's Eligible Voter Population
- The Hispanic population in Arizona is the fifth-largest in the nation. Nearly 2 million Hispanics reside in Arizona, 4% of all Hispanics in the United States.
- The population in Arizona is 30% Hispanic, the fourth-highest Hispanic population share nationally.
- There are 766,000 eligible Hispanic voters in Arizona-the fifth-largest Hispanic eligible-voter population nationally. California ranks first with 5.4 million.
- Nearly two-in-ten (18%) of eligible voters in Arizona are Latinos, the fouth-largest Hispanic eligible population nationally. New Mexico ranks first with 38%.
- Some 39% of Latinos in Arizona are eligible to vote, ranking Arizona 23rd nationwide in the share of the Hispanic population that is eligible to vote. In contrast, 79% of the state's white population is eligible to vote.
So how do the Democratic districts rank in terms of unregistered eligible voters compared to the Republican districts ? And where are the districts with large Hispanic VAP proportions rank in terms of unregistered eligible voters ?
What I found was taking the average of the 15 most Democratic LDs and comparing it with the average of the 15 most Republican LDs and the Total LDs there are far more unregistered eligible voters in the 15 most Democratic districts (Note: as per my previous diaries I use Index 2 of Compactness and Competitiveness Report by the IRC).

Surprisingly there does not appear to be much difference in VAP between the 15 most Democratic LDs and the 15 most Republican LDs. I thought the Republican LDs would have far more Snowbirds... and the Democratic LDs more young Hispanics. On the other hand there are large differences in the number of Hispanics, with the Blue LDs having far higher proportions of Hispanics. Importantly Democrat LDs have a far bigger gap between %VAP per district and %registered voters per seat.
DOES LOWER VOTER ELIGIBILITY AMONG HISPANICS HAVE AN IMPACT ?
So it seems that all of the Blue districts seem to be where the opportunities exist. However, given the lower citizenship rates amongst Arizona Hispanics (mostly Mexican Americans) is there a far smaller voter pool of eligible unregistered voters ? Even so, does it matter given the traditionally low voter turnout rates for the Hispanics community, there is still likely a large amount of eligible Hispanic voters out there ?
To test these theories I spent hours trying to find the Citizen Voting Age Population (CVAP) stats for Arizona by Legislative District for Hispanics. I finally found it in the submission by the Independent Redistricting Commission to the Department of Justice for Voting Rights Act pre-clearance.
The following tables show the top 15 and the bottom 15 LDs in order of number of unregistered VEP, which is a more accurate than the above tables which looked at unregistered VAP.
I created these tables assuming 100% eligibility for Non-Hispanic Whites and other Minorities. So the total VEP for each district simply adds Hispanic CVAP+Non Hispanic White VAP and Non Hispanic Minority VAP.
This of course is a worse case scenario for the Democrats as I presume that there are several districts with substantial "Snowbird" populations who are registered in other States and who are therefore ineligible to vote. One or two Blue seats in Phoenix may also have some students who are registered to vote elsewhere.
The top 16 seats are almost all Democratic ! I guess this is great news for OFA, as I guess this is better than being the minority party in AZ and have no growth potential.
Generally speaking the best opportunities for the Dems to register voters are in Phoenix, with the Tucson seats having slightly higher existing registration rates.
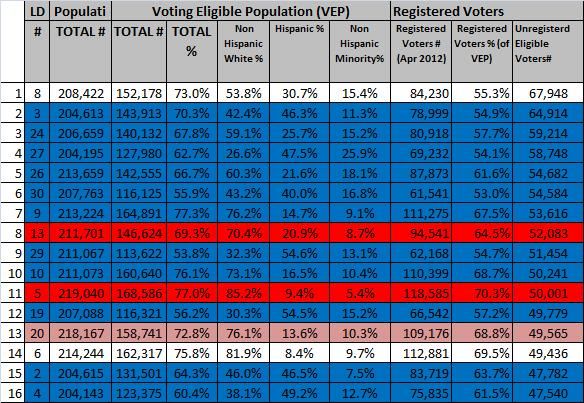
With most other seats having 47,000-60,000 eligible unregistered voters, there are two seats that have around 65,000 eligible unregistered voters, the Tucson based 3rd and the Pinal County/Gila County Copper Corridor based 8th (possibly the last of the Pinto Democrat seats). The 8th has a large degree of racially polarized voting, with only the Rios family being successful Hispanic Democrats in the seat. As all three of our House candidates for the seat are Hispanic, we could really use some increased voter registration in this seat. On the other hand our State Senate candidate is Barbara McGuire, a Non-Hispanic White candidate who survived the 2010 bloodbath.
The bottom 14 seats include all bar one (LD-20) of the Republican held Phoenix seats seats all of which have voter registration % of 72-86% of the VEP. There is also two regional Republican seats - Prescott based 1st and Cochise County based 14th, and the competitive 18th.

There is only one Dem seat - Navajo Nation, which has the least voter registration opportunity due to an incredibly young population combined with a very high proportion of registered voters. This seat will be crucial for the Dems to win AZ-01, but reportedly turnout is higher in the mid-terms as that is when Navajo Nation has their elections.
HOW AZ REGISTRATION RULES CAN TURN DEM COUNTIES GOP
The Arizona Secretary of State website publishes statistics from 1997 onwards... the period when Republicans started to consistently win the Secretary of State position. So I don't know how it was done previously. While it is not as bad as Florida's ad-hoc voter purges Arizona is thorough in ridding the role of inactive voters. All statistics are presented with "active" voters and "inactive" voters listed separately (although the latest April statistics infuriatingly don't show the number of inactive voters).
I haven't included my full working tables on this, but if you add the number of inactive Dem voters to the number of active Dem voters, basically inactive voters form the following percentages of total voters: 13.4% in Jan 2008, 9.7% in Jan 2009, 7.6% in Jan 2010, 9.8% in Jan 2011, and 12.7% in Mar 2012. Interestingly the SOS website never provides total numbers, always keeping them separately.
By consistently ridding the rolls of these voters, they have managed to go from having 10 of 15 Arizona Counties Democratic in January 2009 to 7 of 15 in March 2012. Pinal, Gila and Graham Counties have all been turned Republican despite being the historic strongholds of the Pinto Democrats. This clearly can very quickly have an impact and assist the strong exurban growth in Pinal County in particular (where Paul Babeau is the first Republican elected as County Sheriff and the 2nd elected Republican county official).
Each County Recorder needs to keep two lists - one of "active voters" and one of "inactive voters". Basically the law requires County Recorders to check voter registration each May, and if people appear to have changed addresses then the County Recorder sends them a notification that must be responded to 29 days before the election. If this fails to occur then they are moved onto the inactive voter list. This means they will need to provide proof of address to vote and other measures. So obviously this sounds all mild mannered and fine to Republicans but we all know that the system is designed to depress Democratic turnout - it is a crude method that hits Republicans too of course.
But yeah this system is designed to deter poor voters who change addresses regularly (far greater proportion of renters) and who don't necessarily have access to a car... The greater the trial it is to cast a ballot on election day... the greater the chance they will stay at home.
Changes to Voter Registration
There has been a big win on some important aspects of the voter registration process. In 2004, proposition 200 required County Officials to reject any voter registration application that did not also provide proof of citizenship. MALDEF subsequently won a suit (Gonzalez v. Arizona, 08-17115), against the State on the issue of submitter voter identification with registration. The Court of Appeal decided in Oct 2011 and again in April 2012 that this provision conflicted with the National Voter Registration Act's provisions to increase voter turnout. There is a good summary here. Arizona, of course decided to appeal the 9th Circuit's decision to the Supreme Court. But as revealed in a diary by alaprst (and maybe others not sure) (Tip of the hat to KingofSpades for bringing this to my attention in a timely fashion) the Supreme Court
declined to stay the ruling by the Ninth Circuit... this means there is no funny business before the November elections. Not the final win on the matter, but a moral boosting victory.
CONCLUSIONS
So great news ! We have increased the Dem share of registered voters substantially before, just in 2008, and we can do it again. Bad news is that we have to do it again just to ensure we don't go backwards. Based on my research I can confirm a few things:
1. (To State The Obvious) Arizona is a state where rapid population growth combined with changing demographics has and will greatly .
2. (To State The Obvious) The GOP has dominated Presidential Elections since 1952, when Maricopa County increased to around 50% of the State population. The GOP have held the State House of Representatives ever since 1966 after one person, one vote saw the demise of the Pinto Democrats system of malapportionment, and later took the State Senate in 1978 by taking out the last stragglers of the Suburban Maricopa Dems.
3. Historically, voter registration in Arizona steadily increased... until the modern era of Republican Secretaries of State, where the number of registered voters has often plateaued. The number of Republican voters passed the number of Democratic voters in 1986, but never reached an outright majority. From 1998 when Independents were allowed to vote in party primaries, the number of Registered Independents has increased each year, and passed the number of Registered Democrats in 2010.
4. The number and % of Democrats increased for the first time in the modern era in 2008 in the lead up to the Presidential Election.
5. The % of Registered Democrats is now only 30%... a historic low after the enthusiastic enforcement of Arizona's voter registration rules by the Romney Campaigns' Arizona Chairman and Arizona Secretary of State Ken Bennett. But the actual voter registration gap between Dems and GOP is not so large and could be overcome, but this may not be the best indicator of Likely Dems vs Likely GOP.
6. The April 2012 Voter Registration figures are the first released by the Secretary of State that show registration by the new Congressional Districts and Legislative Districts. Compared to the figures used by the Arizona Independent Redistricting Commission, the % of Democratic voters have decreased in every Legislative District. Between March and April the number of Registered Democrats increased by 1958... at this rate we might get 10,000 extra registered Democrats... but not an extra 100,000.
7. The Hispanic population in Arizona has increased, including in the Republican stronghold of Maricopa County, the lynchpin of their winning margins over the years. Looking at the Voter Eligible Population in each Legislative District compared to the number of registered voters, the Republican Districts aside from rural areas are already highly engaged with high % of the VEP registered as voters. By contrast the Democratic Districts and some competitive battlegrounds have large numbers of the VEP who are not registered. The Republican districts generally have 25,000-40,000 unregistered eligible voters, whereas the Democratic district generally have 42,000-60,000 unregistered eligible voters. There is therefore much greater room for growth in the Democratic vote, and the Hispanic vote in particular.
8. If Obama for America register 100,000 voters, there will still likely be a huge number of active voters (eg. 10%) that Ken Bennett will no doubt enthusiastically push to the inactive voter roll (which he can do lawfully). But with Prop 200 repealed there should be no artificial barrier to OFA registering new voters !
QUESTIONS
Please let me know if there is any key data that you think I have missed... Or if I have made any errors in my sums... Or if any of it doesn't make any sense whatsoever.
NOTE: Below the fold are some of the other numbers that I looked at, which will not interest most.
SOME OF THE NUMBERS
Table 1: Historical Party Registrations (Post 1966)
| Election Year |
Democrat # (%) |
Republican # (%) |
Other # (%) |
Total Reg. Voters |
Notes |
2012
(March) |
952,907 (30%) |
1,134,094 (36%) |
1,037,007 (33%) |
3,151,615 |
|
| 2010 |
1,002,937 (32%) |
1,131,802 (36%) |
1,011,679 (32%) |
3,146,418 |
|
| 2008 |
1,022,252 (34%) |
1,118,587 (37%) |
846,612 (28%) |
2,987,451 |
168,024 Dems Registered to Vote |
| 2006 |
854,228 (33%) |
1,014,690 (40%) |
699,483 (27%) |
2,568,401 |
Decent Year for the Dems |
| 2004 |
914,264 (35%) |
1,055,252 (40%) |
673,815 (25%) |
2,643,331 |
Independent Redistricting Revised Map. |
| 2002 |
799,653 (36%) |
925,485 (41%) |
504,042 (23%) |
2,229,180 |
Independent Redistricting New Map. |
| 2000 |
830,904 (38%) |
942,078 (43%) |
400,140 (18%) |
2,173,122 |
|
| 1998 |
912,613 (40%) |
1,013,533 (45%) |
338,145 (15%) |
2,264,291 |
|
| 1996 |
911,024 (41%) |
1,012,282 (45%) |
314,459 (14%) |
2,237,765 |
|
| 1994 |
873,413 (42%) |
933,642 (45%) |
267,978 (13%) |
2,075,033 |
|
| 1992 |
833,997 (42%) |
889,644 (45%) |
239,851 (12%) |
1,963,492 |
|
| 1990 |
779,351 (42%) |
871,073 (47%) |
208,517 (11%) |
1,858,941 |
Great Year for the Dems |
| 1988 |
767,181 (43%) |
821,323 (46%) |
209,212 (11%) |
1,797,716 |
|
| 1986 |
687,605 (43%) |
726,199 (45%) |
182,275 (12%) |
1,596,079 |
Dems Lose the Party Registration Battle |
| 1984 |
663,851 (45%) |
647,544 (44%) |
149,733 (11%) |
1,461,128 |
|
| 1982 |
535,530 (47%) |
508,606 (45%) |
98,023 (8%) |
1,142,159 |
|
| 1980 |
531,977 (47%) |
490,403 (44%) |
98,301 (9%) |
1,120,681 |
Dem Registration Only Plurality |
| 1978 |
496,206 (51%) |
404,421 (42%) |
68,803 (7%) |
969,430 |
Dems Lost Control of Senate |
| 1976 |
510,805 (52%) |
399,227 (41%) |
69,622 (7%) |
979,654 |
Dems Losing Control of Senate |
| 1974 |
466,908 (52%) |
370,759 (42%) |
53,127 (6%) |
890,794 |
Dems Still Control Senate |
| 1972 |
455,985 (53%) |
362,196 (42%) |
43,631 (5%) |
861,812 |
|
| 1970 |
335,327 (54%) |
263,574 (43%) |
19,510 (3%) |
618,411 |
|
| 1968 |
343,509 (56%) |
253,928 (41%) |
17,281 (3%) |
614,718 |
|
| 1966 |
351,266 (61%) |
213,897 (37%) |
12,509 (2%) |
577,672 |
Republicans win the State House |
I have split the tables on Historical Party Registration Increase, as post 1998 the number of Registered Independents increased dramatically, so it is much harder to tell the difference between left and right leaning voters.
Table 2: Historical Party Registration Increases (Post 1998)
| Timeframe |
Democrat Increase # (%) |
Republican Increase# (%) |
Other Increase# (%) |
Total GOP-Dem Reg. Gap |
Pres/Gov/SOS |
| 2010-2008 |
-19,315 |
13,215 |
165,067 |
128,865 |
Obama (D) / Brewer (R) / Bennett (R) |
| 2008-2006 |
168,024 |
103,897 |
147,129 |
96,335 |
Bush II (R)Napolitano (D)/Brewer (R) |
| 2006-2004 |
-60,036 |
-40,562 |
25,668 |
160,462 |
Bush II (R)/Napolitano (D)/Brewer (R) |
| 2004-2002 |
114,611 |
129,767 |
169,773 |
140,988 |
Bush II (R)/Napolitano (D)/Brewer (R) |
| 2002-2000 |
-31,251 |
-16,593 |
103,902 |
125,832 |
Bush II (R)/Hull (R)/Bayless (R) |
| 2000-1998 |
-81,709 |
-71,455 |
61,995 |
111,174 |
Clinton (D)/Hull (R)/Bayless (R) |
Okay the column showing the GOP-Dem registration gap has Dem leads in brackets, before the 1986-1984 period where GOP has consistently had a registration lead. While the increase in Republican voters was due to new Arizona residents, you can see that in some years the Dems did poorly as the Pinto Democrats changed to Republicans.
Table 3: Historical Party Registration Increases (Post 1966)
| Timeframe |
Democrat Increase # (%) |
Republican Increase# (%) |
Other Increase# (%) |
Total GOP-Dem Reg. Gap |
Pres/Gov/SOS |
| 1998-1996 |
1589 |
1,251 |
23,686 |
100,920 |
Clinton (D)/Hull (R) Bayless (R) |
| 1996-1994 |
37,611 |
78,640 |
46,481 |
101,258 |
Clinton (D)/Symington III (R)/Hull (R) |
| 1994-1992 |
39,416 |
43,998 |
28,127 |
60,229 |
Clinton (D)/Symington III (R)/Mahoney (D) |
| 1992-1990 |
54,646 |
18,571 |
31,334 |
55,647 |
Bush I (R)/Symington III (R)/Mahoney (D) |
| 1990-1988 |
12,170 |
49,750 |
-695 |
91,722 |
Bush I (R)/Mofford (D)/Shumway (D) |
| 1988-1986 |
79,576 |
95,124 |
26,937 |
54,142 |
Reagan (R)/Meacham (R)/Mofford (D) |
| 1986-1984 |
23,754 |
78,655 |
32,542 |
38,594 |
Reagan (R)/Babbitt (D)/Mofford (D) |
| 1984-1982 |
128,321 |
138,938 |
51,710 |
(16,307) |
Reagan (R)/Babbitt (D)/Mofford (D) |
| 1982-1980 |
3,553 |
18,203 |
-278 |
(26,924) |
Reagan (R)/Babbitt (D)/Mofford (D) |
| 1980-1978 |
41,574 |
85,982 |
29,298 |
(41,574) |
Carter (D)/Babbitt (D)/Mofford (D) |
| 1978-1976 |
-14,599 |
5,194 |
-819 |
(91,785) |
Carter (D)/Bolin (D)/Mofford (D) |
| 1976-1974 |
43,897 |
28,468 |
16,495 |
(111,578) |
Ford (R)/Castro (D)/Bolin (D) |
| 1974-1972 |
10,929 |
8,563 |
9,496 |
(96,149) |
Nixon-Ford (R)/Williams (R)/Bolin (D) |
| 1972-1970 |
120,658 |
98,622 |
24,121 |
(93,789) |
Nixon (R)/Williams (R)/Bolin (D) |
| 1970-1968 |
-8,182 |
9,646 |
2,229 |
(71,753) |
Nixon (R)/Williams (R)/Bolin (D) |
| 1968-1966 |
-7,757 |
40,831 |
4,772 |
(89,581) |
Nixon (R)/Williams (R)/Bolin (D) |
| 1966-1964 |
-14,010 |
8292 |
-894 |
(137,369) |
Johnson (D)/Goddard, Jr. (D)/Bolin (D) |
Table 4: Historical Registration by County
| County |
Dem (2010%) |
GOP (2010%) |
Oth (2010%) |
Total Reg (2010 %) |
Total Pop (2010) |
Year GOP Vote Overtook Dems |
| Apache |
26,458 (60.06%) |
6,949 (15.77%) |
10,644 (24.16%) |
44,051 (62.40%) |
70,591 |
N/A |
| Cochise |
23,438 (30.25%) |
29,097 (37.56%) |
24,942 (32.19%) |
77,477 (58.99%) |
131,346 |
2004 |
| Coconino |
27,645 (40.18%) |
18,433 (26.79%) |
22,727 (33.03%) |
68,805 (51.19%) |
134,421 |
N/A |
| Gila |
11,800 (39.13%) |
11,143 (36.95%) |
7,216 (23.93%) |
30,159 (56.27%) |
53,597 |
2012 |
| Graham |
6,823 (38.83%) |
7,340 (41.78%) |
3,407 (19.39%) |
17,570 (47.21%) |
37,220 |
2010 |
| Greenlee |
2,443 (58.13%) |
1,013 (24.10%) |
747 (17.77%) |
4,203 (49.82%) |
8,437 |
N/A |
| La Paz |
2,969 (33.06%) |
3,273 (36.45%) |
2,736 (30.47%) |
8,978 (43.81%) |
20,489 |
2003 |
| Maricopa |
541,711 (29.25%) |
703,288 (37.98%) |
606,957 (32.77%) |
1,851,956 (48.52%) |
3,817,117 |
1970 |
| Mohave |
28,210 (24.25%) |
46,663 (40.11%) |
41,465 (35.64%) |
116,338 (58.11%) |
200,186 |
1982 |
| Navajo |
24,815 (43.01%) |
18,274 (31.67%) |
14,613 (25.32%) |
57,702 (53.70%) |
107,449 |
N/A |
| Pima |
187,259 (38.48%) |
151,502 (31.13%) |
147,936 (30.40%) |
486,697 (49.65%) |
980,263 |
N/A |
| Pinal |
52,656 (32.05%) |
54,000 (32.87%) |
57,636 (35.08%) |
164,292 (43.72%) |
375,770 |
2010 |
| Santa Cruz |
11,243 (53.46%) |
3,744 (17.80%) |
6,042 (28.73%) |
21,029 (44.34%) |
47,420 |
N/A |
| Yavapai |
28,230 (23.31%) |
53,793 (44.41%) |
39,095 (32.28%) |
121,118 (57.39%) |
211,033 |
1972 |
| Yuma |
27,225 (36.19%) |
23,311 (30.99%) |
24,682 (32.81%) |
75,218 (38.43%) |
195,751 |
N/A |


