I considered tacking on "Southern Fried Redistricting" to the title, but it would have broken my format for the series so I'm wasting your time to mention it here.
The concept behind this series is simple, the proportional body of Congress, the House, is brutally gerrymandered throughout the country. I wanted to look at some states where possible independently produced maps could have major ramifications on the composition of the body and the power status in America.
What I want to do with this series is to show the effect of having bipartisan public committees handle redistricting efforts, with criteria of compactness, regional interests, and party-balance, with an emphasis on creating politically competitive districts where possible.
For this I chose to tackle the states that Republicans pushed the most egregious gerrymanders, states where they mangled the rights of voters, packed Democrats, split counties with impunity, and hashed districts together with no regard for community of interests.
I have already covered Texas and Pennsylvania.
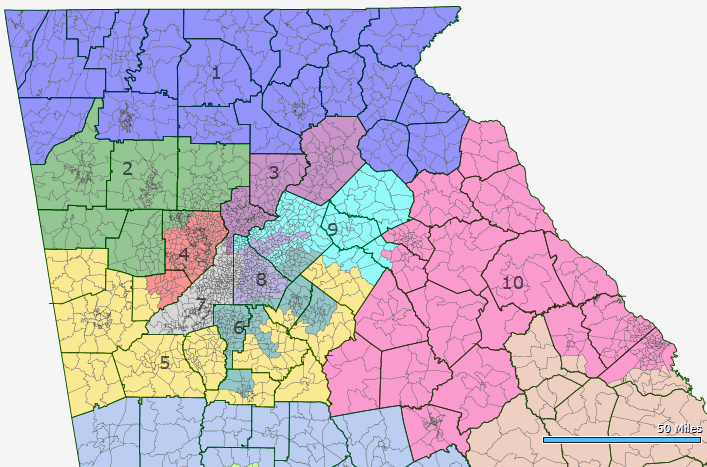
GA-01 (Blue):
2008 Presidential Results
25.5% Obama, 73.2% McCain
Average Partisan Results:
32.3% Democratic
67.7% Republican
Voting Age Demographics:
Why bother. This is a white district. They don't show anything.
District Summary:
This district is largely analogous with the current 9th, and is represented since the 2010 Special Election to replace now Gov. Nathan Deal, by Representative Tom Graves. I removed Hall County, (which my family apparently had a role in creating, and funded the construction of the original county courthouse), because Gainesville has essentially turned into an Atlanta exurb at this point. It's a larger and fast-growing county. My main intent was to remove the district from suburban Atlanta, and to create an entirely rural, North Georgia district that took in all the mountains and represented that region. Not much changed politically. This was the 3rd most Republican district in the country in the 2006-2010 iteration of maps, and is still high up there now.
GA-02 (Green):
2008 Presidential Results:
Obama 29.1%, McCain 69.4%
Average Partisan Results:
31.8% Democratic
68.2% Republican
Voting Age Demographics:
To be clearer, I am saving time and space by not bothering with this for the safely Republican districts.
District Summary:
This shares a lot of space with Representative Phil Gingrey's district. Gingrey actually lives in Marietta, which is in the 4th. But I believe he'd probably choose to run in this safely Republican district that takes in Rome, Georgia (which in 2002 was apparently swingish territory for State Democrats), and the western rim of Georgia suburbs. It's a compact district though and seems pretty solid considering regional interests.
GA-03 (Purple):
2008 Presidential Election Results:
31.8% Obama, 67.1% McCain
Average Partisan Results:
29.6% Democratic
70.4% Republican
District Summary:
This area takes in a large portion of Representative Tom Price's previous district, and contains his home in Roswell, GA, an Atlanta suburb in that strange, northern protrusion of reliably Democratic Fulton County. It takes in all of Forsyth (I again tried to avoid county splitting where it could be conveniently avoided), and gains Hall County. This is safely Republican turf, which probably suits Price, a member of the Republican leadership in the House and a big proponent of the flat tax.
GA-04 (Red):
2008 Presidential Results:
Obama 46.3%, McCain 52.4%
Average Partisan Results:
45.4% Democratic
54.6% Republican
Voting Age Population:
56.9% White
26.7% Black
10.3% Hispanic
4.2% Asian
District Summary:
I went through several maps, several iterations. I ended up settling on this version, as opposed to some that created more sprawling, Democratic-leaning suburban seats. This one was compact, and consolidates Cobb County into mainly one district, with the Democratic leaning and trending Eastern half of Douglas County added in. This is a fairly diverse district, and getting moreso. Democrats, from my impression, are a little better organized in Cobb County as opposed to Gwinnett because Cobb has been quite competitive the last few decades. I think this district would spawn a marquee race, and it filled my desire to make a compact swing district in the Atlanta area that didn't trample over community interests (i.e. no drawing north Fulton and Dekalb and Gwinnett together, weighing down white suburban Republican voters with inner city black neighborhoods). I do think the Republican candidate would be marginally favored, at least over the next few cycles.
GA-05 (Yellow):
2008 Presidential Election Results:
31.2% Obama, 67.6% McCain
Average Partisan Results:
33.1% Democratic
66.9% Republican
District Summary:
This district, which ended up sprawling and contorting as it took in the outer suburbs beyond the VRA required districts, is represented by the truly reprehensible Representative Lynn Westmoreland. Rep. Westmoreland first became infamous after sponsoring bills to place 10 Commandment monuments in both Houses of Congress and Courthouses, and then appearing on The Colbert Report and was only able to name 3 of them (his secretary disputed this, saying that in the unedited interview Westmoreland named 7). Rep. Westmoreland then led a small group of Congressman in opposition to the VRA, saying it was unfair to target their states. Then in 2008, he called Barack and Michelle Obama uppity, and then, (this truly defies belief), responded to criticism by saying, "I’ve never heard that term used in a racially derogatory sense. It is important to note that the dictionary definition of ‘uppity’ is ‘affecting an air of inflated self-esteem — snobbish.’ That’s what we meant by uppity when we used it in the mill village where I grew up." It's unfortunate that he'll stay in Congress with this district as it demeans the honor of the Institution to have an individual like him in it.
GA-06 (Teal):
2008 Presidential Election Results:
67.9% Obama, 31.4% McCain
Average Partisan Results:
64.7% Democratic
35.3% Republican
Voting Age Demographics:
33.3% White
52.8% Black
8.4% Hispanic
3.8% Asian
District Summary:
We finally come to the first district in Georgia won by Obama. This district contains many of the heavily black suburban areas around Atlanta, including a small chunk of South DeKalb, and the southeastern corner of Gwinnett. My calculations were that this would be the district Representative David Scott would run in. I can't say I care for Scott, who is a member of the New Democrats Coalition and the Blue Dog Coalition, and has supported a national constitutional amendment to ban Gay Marriage on two separate occasions. And has some recurring issues with corruption. Democrats could do much better in this district (which Scott initially drew for himself in 2002, as the 13th District).
GA-07 (Gray):
2008 Presidential Election Results:
78.3% Obama
20.9% McCain
Average Partisan Results:
75.7% Democratic
24.3% Republican
Voting Age Population:
36.2% White
51.4% Black
7.2% Hispanic
3.5% Asian
District Summary:
Civil Rights icon John Lewis represents this district, which I don't think saw any exceptional changes. It remains overwhelmingly Democratic, and Atlanta-based.
GA-08 (Grayish Purple):
2008 Presidential Election Results:
Obama, 82.3%, McCain 17%
Average Partisan Results:
78% Democratic
22% Republican
Voting Age Demographics:
23.2% White
51.9% Black
15.9% Hispanic
7.1% Asian
District summary:
Representative Hank Johnson represents this DeKalb County district, and it gets even more Democratic. The only issue he should have as an incumbent is his continuing struggle against Hepatitis C.
GA-09 (Cyan):
2008 Presidential Election Results:
Obama 34.7%, McCain 64.3%
Average Partisan Results:
35% Democratic
65% Republican
District Summary:
Representative Rob Woodall has the best claim on this district of anyone, and would probably run here. I realized after I saved the images onto Photoshop that I accidentally split Lawrenceville, the County Seat of Gwinnett and Woodall's home, 3-ways. I have just now corrected that, but the affect on all the other congressional districts or this one. Woodall was former Rep John Linder's Chief of Staff, and has the distinction of being perhaps the only Republican Representative from Georgia who isn't completely crazy. Even if he is also a Fair Tax proponent, he did refuse to sign Norquist's pledge.
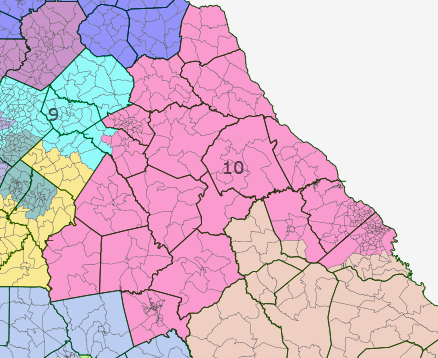
For some reason the site cut off the edge of this district in the first map I posted, so I had to post another to show the whole thing.
GA-10 (Neon Pink)
2008 Presidential Election Results:
47.6% Obama, 51.4% McCain
Average Partisan Results:
49.3% Democratic
50.7% Republican
Voting Age Demographics:
61.1% White
30.8% Black
4.3% Hispanic
2.4% Asian
District Summary:
Well, speaking of, um, colorful Georgia Republicans, to put it mildly, or rigid ideologue loudmouth, to put it in less polite, media white-washed terms, there's Representative Paul Broun. Aside from just being generally among the most conservative members of the House, there is this statement Broun made just after the 2008 Presidential Election: "That's exactly what Hitler did in Nazi Germany and it's exactly what the Soviet Union did. When he's proposing to have a national security force that's answering to him, that is as strong as the U.S. military, he's showing me signs of being Marxist." And he kept piling it on after the criticism came, "We can't be lulled into complacency. You have to remember that Adolf Hitler was elected in a democratic Germany. I'm not comparing him to Adolf Hitler. What I'm saying is there is the potential of going down that road." This district surprised me. I had an initial idea of drawing a central East-Georgia district connecting Athens with Augusta, but I had no idea at just how perfect a compact, swing district it would make. It was a happy surprise. What's more is that the Democratic Average of state elections was significantly higher than Obama's total in the trio of counties at the north end of the district, in Madison, Hart, and Elbert counties. With some Democratic leaning, minority heavy counties in the southern end, plus the heavily Democratic regions of Richmond County and the Rock-ribbed Democratic county of Athens, it makes a very competitive district. Truth be told, I have suspicions that Rep. Barrow would run here. For those with long memories, Barrow was County Commissioner from Clarke County when he ran and unseated Rep. Max Burns in 2004. Republicans, in their first attempt to eliminate Barrow drew his home and political base into a heavily Republican Atlanta suburb district, and then made the remainder significantly more Republican (and they tried even more ambitiously to get rid of him the next time around). In a new district like this, I imagine Barrow would find it a tempting locale to run, especially since he's already pretty well known in the Clarke and Richmond county portions. It'd be a race to watch, but I think, given Broun's tendency towards controversy, a conservative white Democrat like Barrow would be favored.
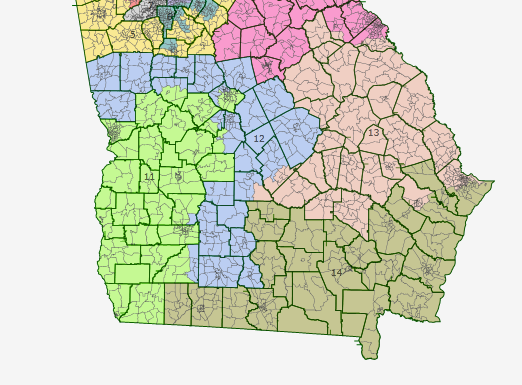
GA-11 (Chartreuse):
2008 Presidential Election Results:
58.1% Obama, 41.3% McCain
Average Partisan Results:
59.2% Democratic
40.8% Republican
Voting Age Demographics:
45.3% White
48.2% Black
3.9% Hispanic
1.3% Asian
District Summary:
Representative Sanford Bishop's current district isn't majority black either, and southeast Georgia is shrinking in population so the district had to expand. I took the route Republicans took with their latest map and took in Macon, GA, and increased the black population by a few percentage points. The Total Population of the district is actually 50.5% black. It's more Democratic as well, obviously. Hopefully Bishop won't get caught napping against like he almost was in 2010.
GA-12 (Grey Sky Blue):
2008 Presidential Election Results:
35.8% Obama, 63.5% McCain
Average Partisan Results:
39.9% Democratic
60.1% Republican
District Summary:
This district is a mess. Again I blame the VRA, jokingly of course. But wherever one district ended up looking messy on this map, it was to accommodate the VRA and create majority-minority districts. This 12th pretty much encases the 11th, protecting it from Atlanta to the north, and South Carolina far to the east. It takes in a broad loop of rural, mostly white South Georgia territory, and so, in actuality, I don't see this district as really failing to represent a generally homogenous cultural and economic collection of interests. Representative Austin Scott, who narrowly defeated Jim Marshall in 2010, would have no trouble in this safely Republican district.
GA-13 (Flesh Pink):
2008 Presidential Election Results:
48.8% Obama, 50.6% McCain
Average Partisan Results:
50.3% Democratic
49.7% Republican
Voting Age Demographics:
57.1% White
34.9% Black
5.2% Hispanic
1.5% Asian
District Summary:
This map is rather kind of Representative John Barrow actually. It gives him two different districts where he could choose to run in, both of which are more favorable to him than the current one Republicans drew. This new version of his district was another surprise to me. I had expected it would be Republican leaning (like Barrow's current district), after drawing Augusta out of it. I was wrong. It's about 5% less black than the 2006-2010 version, but is a near perfect swing district. Barrow could easily win here, if chose to run in this district, as he's a good fit for the district and the bulk of the territory is familiar to him. There are probably other southern Democrats who could still hold and win this territory without much difficulty.
GA-14:
2008 Presidential Election Results:
35.9% Obama, 63.4% McCain
Average Partisan Results:
40.1% Democratic
59.9% Republican
District Summary:
Representative Jack Kingston has a typical Deep South Republican profile. Creationism is valid science? Check. But Anthropogenic Global Warming is skeptical science? Check. However beyond that he is a relatively unoffensive Congressman, by Deep South Republican terms, and he seems to be a pretty personally intelligent and affable guy. So, this district could do worse.
--
So, to sum up this map partisan-wise, it creates 7 safe Republican seats, 4 safe Democratic seats, and 3 pure swing districts. I hardly think this arrangement can be declared to be unfair to anyone. It's a mostly compact map that represents local divisions pretty well insofar as my Georgia understanding goes, and creates a balanced map to represent the state's interests and political beliefs. Obama did well here in 2008, and should probably come within 1-2 points of that showing this year. If I had to make predictions on the swing districts, I'd say the 10th and 13th go Democratic, while the 4th goes Republican. Which gives Republicans 57% of the Congressional delegation, in a state Romney will probably only get around 53-54% of the vote in. So this isn't a map that over-represents Democrats.
Next comes Ohio, since it's Voter Initiative to create an independent panel for Redistricting is struggling to get on the ballot right now. When I finish with this series, I will summarize the whole project, and discuss the enormous impact such programs for fair representation in redistricting would have on the entire national political field, including likely changing the balance of power in the House.
P.S. While Dkos does have reader guages, these aren't entirely accurate. I always appreciate users who vote in my poll as that gives a more accurate count of readership. Which is always nice to know for something you worked hard on; sucks to feel like you are talking to a wall.

