Presidential candidate Mitt Romney's wealth has focused increased scrutiny on America's trickle down fiscal policy and offshoring of wealth. Both have been to the benefit of a very small percentage of the American population. In the thirty years (with few aberrations) that American tax policy has reflected the Reagan-era economic model, we can easily measure the effects of Reaganomics. Thirty years on the road to nowhere makes an indelible mark on the map.
The U.S. tax policies of the past thirty years have heavily benefitted the wealthiest and smallest segments of the population. The infamous one-percent, the so-called job creators, have glowed in the largesse of tax policy. Contrary to the skyrocketing wealth of a few, one can easily argue that economic mobility for those on the lowest of the income ladder has stalled. This chart from The World Top Incomes Database shows the history of income distribution over the past thirty years. I added income fluctuations at approximately ten year intervals. Trickle down simply has not happened.
Join me as we look at facts and charts.
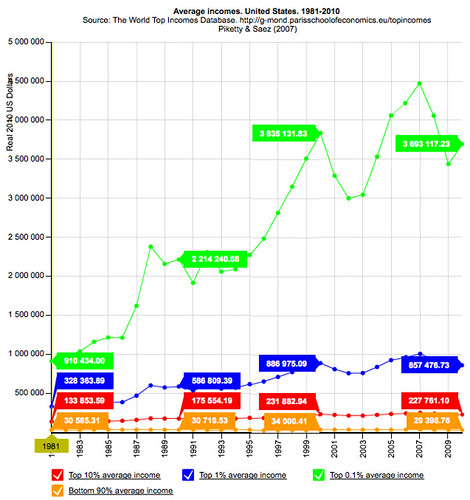
This illustrates the absurdity of supply-side economics and other ideas espoused by its father, Arthur Laffer. Supply-side economics is predicated on a few basic ideas: Cut the taxes of the highest incomes. The wealthy will the use tax savings to invest in production. More investment in production will stimulate demand. Nobel laureate economist Paul Krugman succinctly dismisses this idea from a supply-side perspective: "A corporation that cannot sell its products now will not produce products now." Supply-side economic theory completely ignores the other side of the equation: the demand side.
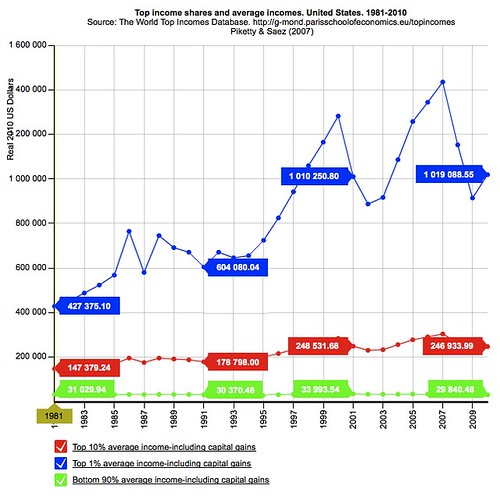
In terms of tax policy, where have the benefits of capital gains tax cuts gone? You may recall that these tax cuts were sold to the public as a kind of stimulus for job creation. The chart below identifies which segment of the income ladder enjoyed most of the 2003 capital gains tax cuts. Again, I augmented the chart with average income levels every ten years.
So has income diverted from the government purse boosted job growth? Let's see how the most comprehensive and current survey of employment (U6 data category) from the Bureau of Labor Statistics measures overall gains.
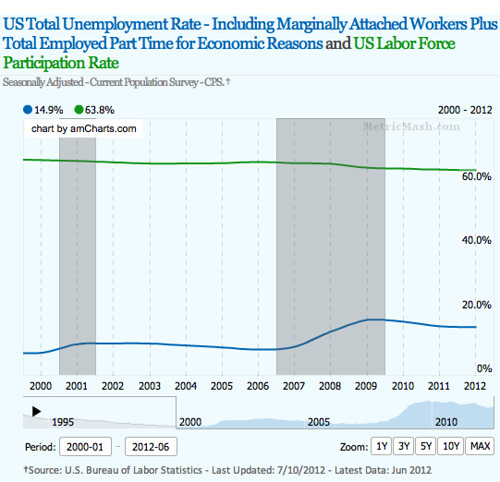
If tax cuts were to yield the promised boost in employment, then the green line signifying labor market participation might have bent toward the top of the chart. Simultaneously, we might have seen a more precipitous drop in unemployment (blue line) from the promise of a capital gains-fueled job boost. The gray areas are recessionary periods.
The charts above yield some basic points. First, everyone was hit hard with the Lesser Depression born in 2007 after the real estate bubble popped and the occidental banking crisis. Second, the top one percent income bracket has recovered nicely. The top ten percent bracket has muddled through the combined crises. These are the fortunate few.
The lower ninety percentile segment has remained in the doldrums with stagnant incomes and a moribund labor participation rate. Throughout this era, stagnant wages have been supplanted with increasing debt burdens. In today's dollars, the median income for average working people has fallen below where it was in 1981.
Like I said earlier - the working and middle class have been thirty years on the road to nowhere.
This was cross-posted at Macroindex.

