Most of us election geeks are really fascinated by maps and redistricting, and the smarter ones among us generally understand that most people aren’t so fascinated. It’s perhaps the ultimate inside baseball issue, difficult for most regular people to even understand.
Every once in a while a committed partisan attempts to raise redistricting-related hijinks as a campaign issue, and generally it falls on deaf ears.
But here in Maryland, our new Congressional map is on this year’s ballot. And though I’ve seen no polling on the issue, I would not at all be surprised to find the map thrown out come November.
As most people who read this site know, Maryland is one of the few states where Democrats controlled every aspect of the redistricting process, and they pulled out all the stops to protect all six of their current incumbent House members while making as unfavorable a district for one of the two Republicans as they could. Obviously many people were not happy with the results.
Obviously the main driver of the referendum is Republicans (and other conservatives) who want at least the second designated Republican/conservative district they had under the 2002-10 map (and maybe more than that) that got taken away from them. But given the high bar for referenda in Maryland, they alone could not have gotten the redistricting map onto the ballot, and would certainly be nowhere near enough by themselves to win the referendum, or even to come particularly close.
They had to have had some help from people who do not normally support their causes.
And what were their complaints? They tended to revolve around three things: too many divided communities of interest; too many disparate and mismatched communities of interest lumped together; and above all the convoluted shapes of many of the districts.
So with all that in mind, I went back to the drawing board. I attempted to draw something that looked at much like the objectionable map as I could, accomplishing as many Democratic goals as possible, while doing away with as many ugly-looking shapes and keeping together as many communities with common interests as was feasible. The idea was to draw a new map that would leave GOP partisans just as outraged as before but cut down on potential objections from the less partisan among those who supported overturning the new map. I did do a bit more county splitting than Maryland has done with their maps in the recent past, but I think I generally did so for decent reasons. (The most blatant thing I did was split heavily Republican Carroll County three ways, but I didn’t do so arbitrarily, keeping the Liberty Road corridor together, the Hampstead-Manchester area together, and not splitting Westminster.)
Without further ado, here goes...
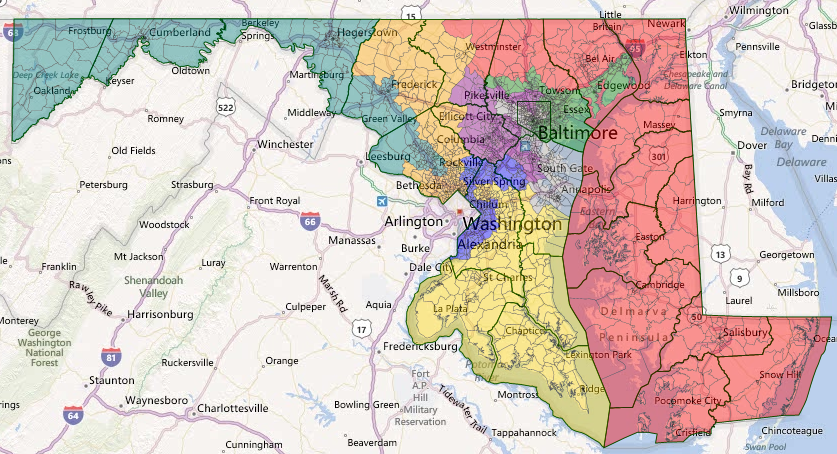
I think it looks somewhat better to the naked eye than the unpopular map the legislature drew earlier in the year.
MD-01 (Red)
Description: Entire Eastern Shore Region (Salisbury, Easton, Elkton); North/Central Harford (Bel Air, Fallston); Northern Baltimore County (Hereford, Parkton); Northeast Carroll (Manchester, Hampstead)
VAP Demographics: 81.8% White, 11.3% Black, 3.3% Hispanic, 1.7% Asian
2008 Presidential: 59.6% McCain, 38.3% Obama
2006-08 Average: 59.1% GOP, 40.9% Dem
Incumbent: Andrew Harris (R-Cockeysville)
This version of the Republican vote sink loses the Anne Arundel County stuff, instead taking in more of Baltimore County and extending into portions of Carroll County. It’s more or less the same district, made even redder by removing the Anne Arundel portion (which were generally red but contained a few 50/50 type precincts) and replacing it with heavily Republican sections of Baltimore and Carroll counties. The bad news is that we’re stuck with Harris and his successors; the good news is the rest of the delegation should consist entirely of Democrats most of the time, and as someone with no cross-party appeal and no need to ever develop any to get re-elected, Harris isn’t likely to advance beyond this safe House seat.
MD-02 (Green)
Description: Various Portions of Baltimore City (Ramblewood, Hamilton, Cedonia, Highlandtown, Canton, Fells Point, Downtown, Mt. Vernon, Bolton Hill, Pigtown, Federal Hill, Westport, Brooklyn); East/Central/NW Baltimore County (Dundalk, Essex, Parkville, Lutherville, Cockeysville, Mays Chapel, Resisterstown); South Harford (Edgewood, Aberdeen, Havre de Grace)
VAP Demographics: 64.3% White, 24.8% Black, 4.9% Hispanic, 4.2% Asian
2008 Presidential: 57.4% Obama, 40.4% McCain
2006-08 Average: 62.4% Dem, 37.6% GOP
Incumbent: C.A. “Dutch” Ruppersburger (D-Cockeysville)
This version of MD-02 has fewer random tentacles and becomes more; it still has an arm that follows the northern part of the Baltimore Beltway but does not go south or west of Baltimore City and doesn’t include any of Anne Arundel or Howard Counties. In exchange for excluding a lot of bluish suburbs south/west of Baltimore (some of which are really DC suburbs at this point) this version now includes much more of Baltimore City than either of the previous two maps. The result is a purely Baltimore-based district that’s much more cohesive demographically than what it would replace.
It would list as something like D+6 but that’s kind of misleading as it’s not really a swing district. There’s very little in terms of GOP bench at any level here and no part of the district is particularly red across-the-board, not even the portions of otherwise conservative Harford County included here. It’s the kind of district you’d expect a middle-of-the-road incumbent like Ruppersburger to win regularly without much trouble, especially since he’s fairly familiar with most of what little new turf he’d get.By the 2008 top-line numbers it’s admittedly less Democratic than either the 2012 map or the 2002-10 map it replaced…but Democrats are much stronger downballot here than that number would suggest. Obama famously underperformed among the predominantly working-class white suburbs of eastern Baltimore County, and there are also a few precincts with many Jewish voters near Reisterstown where Obama failed to match either Kerry’s 2004 numbers or normal Democratic numbers.
There is a bit of concern the weak Obama numbers might indicate a move towards Republicans among many voters here, but it’s hard to imagine a Republican really getting much traction in a district that includes this much of Baltimore City.
MD-03 (Purple)
Description: North/NW Baltimore City (Charles Village, Guilford, Homeland, Roland Park, Hampden, Mt. Washington, Upper Park Heights); Central/West Baltimore County (Towson, Pikesville, Owings Mills, Catonsville); Southern Carroll (Sykesville, Eldersburg); Most of Howard County (Elkridge, Ellicott City, Columbia); West/Central Anne Arundel (Hanover, Severn, Millersville)
VAP Demographics: 65.1% White, 19.5% Black, 9.2% Asian, 4.2% Hispanic
2008 Presidential: 59.4% Obama, 38.6% McCain
2006-08 Average: 61.0% Dem, 39.0% GOP
Incumbent: John Sarbanes (D-Towson)
Has fewer random tentacles and becomes more compact. It includes less of Baltimore City than any recent version of this district, cutting back to a set of neighborhoods in north and northwest Baltimore (totaling about 88,000 residents) that are either predominantly White or racially mixed and lean liberal overall…which actually describes most of the rest of the district as well. It’s more suburbs and less city but at the same time more focused on Greater Baltimore than the district in the 2012 map.
The Dem numbers are a little weaker here than on the current map mostly because there’s less of Baltimore City and because it now has a small chunk (about 46,000 residents, mostly in the Liberty Road corridor) of beet-red Carroll County and doesn’t stretch to Annapolis anymore. (The 102,000 Anne Arundel residents placed here slightly favor Dems to the tune of 52-53%.) Howard County, home to about 38% of this proposed district, would be the new center of gravity. It’s an interesting trivia question that the last three occupants of this House seat in a row have moved to the Senate, and John Sarbanes is in a decent position to follow Ben Cardin, Barbara Mikulski, and his own father to the other side of the Capitol when the time comes.
MD-04 (Blue)
Description: Western/Northern Prince George’s (Ft. Washington, Forestville, Capitol Heights, Landover, Hyattsville, Langley Park, Adelphi, Beltsville, Laurel); NE Montgomery (Calverton, White Oak, Burtonsville); West Anne Arundel (Maryland City, Ft. Meade, Odenton, Crofton)
VAP Demographics: 56.5% Black, 21.0% White, 14.7% Hispanic, 5.6% Asian
2008 Presidential: 84.8% Obama, 14.4% McCain
2006-08 Average: 83.6% Dem, 16.4% GOP
Incumbent: Donna Edwards (D-Fort Washington)
Much like every version of this district since its creation in the 1990s, most of the votes in this majority-black seat are in Prince George’s County (about 77% in this incarnation) and with a PVI of about D+32 it is as safe for Democrats as they come.
Incumbent Edwards famous didn’t like what the legislature drew for her, which caused a few puzzled looks here. This version would be a bit more to her liking, though she would still get a district that would be a little less of a Democratic vote sink than it was prior to redistricting, due to the addition of portions of Anne Arundel County. But unlike the current map, there are no Baltimore-area suburbanites, essentially nothing in the way of hostile territory (even the less blue Anne Arundel portion of the district is 25% Black and gave 58% of its votes to Obama and Democrats) and she even gets to keep a portion of her former Montgomery County territory, which was instrumental in getting her past then-incumbent Albert Wynn in the 2008 Democratic primary.
MD-05 (Yellow)
Description: South/East/Central Prince George’s (College Park, Greenbelt, New Carrollton, Seabrook, Bowie, Clinton, Upper Marlboro); Southern Anne Arundel (Davidsonville, Mayo, Deale); all of Calvert; all of Charles; all of St. Mary’s
VAP Demographics: 49.2% White, 38.9% Black, 6.0% Hispanic, 3.7% Asian
2008 Presidential: 67.4% Obama, 31.5% McCain
2006-08 Average: 69.2% Dem, 30.8% GOP
Incumbent: Steny Hoyer (D-Marysville)
This district doesn’t change much, and didn’t change a lot from its 2002-10 incarnation except to except to shed a little population from northern Prince George’s County and instead to take more of central Prince George’s for geographic contiguity purposes. Thanks to demographic shifts in portions of Prince George’s and Charles Counties, this version of MD-05 now has a minority majority population, though no one group has a majority. The more peripheral parts of Southern Maryland can be pretty conservative, but there’s nothing to be concerned about here. With a PVI of about D+14, this seat should be safe for the current House Minority leader Steny Hoyer, as well as his successor whenever that time comes; further, there’s a decent chance his successor will be African-American if current settlement trends continue.
MD-06 (Teal)
Description: Central/NW Montgomery (Rockville, Gaithersburg, Germantown, Clarksburg, Poolesville); Central/South Frederick (Frederick, Urbana, Brunswick); Entire Western Maryland Region (Hagerstown, Cumberland, Oakland)
VAP Demographics: 66.2% White, 11.8% Black, 10.1% Hispanic, 10.0% Asian
2008 Presidential: 56.0% Obama, 42.2% McCain
2006-08 Average: 55.7% Dem, 44.3% GOP
Incumbent: Roscoe Bartlett (R-Frederick)
This looks a lot like the version currently in force in Maryland, and by design. This district is the main reason the Republicans put the petition drive together, but it’s not necessarily why their referendum will prevail if it does. Certainly the conservative three counties of Western Maryland (35% of the district’s population, giving around 40% of its votes to Democrats across the board) is displeased they got drawn into a district designed to be dominated by a coalition of liberal Montgomery County (46% of the proposed district’s electorate, with both Obama and state Dems netting about 70% of the vote) and swing portions of Frederick County (about 19% of the electorate, going 55% for Obama and 51% for state Democrats ) working together. Even if the Republicans prevail in getting the map thrown out, it will come too late to save current Rep. Roscoe Bartlett, who already faced an uphill battle being a Republican accustomed to taking it easy in a swing district with lots of new constituents before making several unforced campaign errors. Most objective observers seem to think self-funding businessman John Delaney will defeat Bartlett in November.
This district could prove something of a tough hold for Democrats in rough years in the short run. Obama in 2008 overperformed normal Democratic numbers; his showing in Frederick County could be more of a high water mark than the start of a trend. There is no shortage of prominent potential Republican challengers should Delaney or another Democrat stumble. In the long run, the demographic diversification of southern Frederick County and northern Montgomery County should push this district further away from Republican reach, even as Western Maryland has gotten even redder in recent years.
MD-07 (Grey)
Description: Eastern/Western Baltimore City (Frankford, Belair-Edison, Middle East, Northwood, Waverly, Old Town, Reservoir Hill, Park Heights, Forest Park, Edmondson Village, Violetville, Cherry Hill); West/SW Baltimore County (Randallstown, Lochearn, Woodlawn, Arbutus, Halethorpe); North/East Anne Arundel (Linthicum, Glen Burnie, Lake Shore, Pasadena, Severna Park, Annapolis, Arnold, Edgewater)
VAP Demographics: 51.9% Black, 41.1% White, 3.7% Hispanic, 1.7% Asian
2008 Presidential: 71.6% Obama, 27.1% McCain
2006-08 Average: 71.0% Dem, 29.0% GOP
Incumbent: Elijah Cummings (D-Baltimore)
This district looks substantially different than either the current map or the old one. All three of course are based in Baltimore City and contain the lion’s share of that city’s many overwhelmingly Black neighborhoods. This version removes the weird-looking spiral that extends out into Carroll County and instead points southward into Anne Arundel while taking in some predominantly Black suburbs in western Baltimore County.
(There’s a thin strand, corresponding to a stretch of North Avenue near Penn Station, connecting the two chunks of Baltimore, since following Charles Street from one end to the other takes you mostly through predominantly white neighborhoods.)
The PVI here, likely around D+17, is surprisingly low for a black-majority district outside the Deep South. This is partially by design of course, since I included as few majority-white areas that skewed liberal as I could, since they’re needed in the other Baltimore-area districts much more. Apart from Annapolis and a few diverse portions of the Glen Burnie area, the Anne Arundel territory in here (41% of the district) is pretty hostile to Democrats - with Obama actually doing less well (45%) than local Democrats (49%) did - though not as hostile as Carroll County; the Arbutus/Halethorpe section of Baltimore County is a redoubt of Reagan Democrats who didn’t particularly care for Barack Obama. It would be a large number of new constituents for incumbent Cummings, many of whom would not be especially favorably disposed towards him, but this is still a 70+% district for Dems across the boards, more than enough to be considered safe. (Baltimore City accounts for 43% of the district’s electorate, and Republicans there across the board are in single digits.)
If Cummings wants to up his profile and take a shot at a Senate seat down the road, proof of some appeal to swingier suburban voting blocs would go a long way towards quieting doubters.
MD-08 (Orange)
Description: Southern/Central/NE Montgomery (Potomac, Bethesda, Chevy Chase, Silver Spring, Takoma Park, Kensington, Wheaton, Olney, Brookeville, Damascus); Far West Howard (Cooksville, Lisbon); North/East Frederick (Walkersville, Thurmont); North/West Carroll (Mt. Airy, Westminster, Taneytown)
VAP Demographics: 66.5% White, 12.0% Hispanic, 10.8% Black, 8.8% Asian
2008 Presidential: 62.7% Obama, 35.7% McCain
2006-08 Average: 63.7% Dem, 36.3% GOP
Incumbent: Chris Van Hollen (D-Kensington)
Much like the new MD-06, this new version MD-08 seeks to strand a large, mostly rural chunk of conservative votes in a district dominated by strongly Democratic Montgomery County, itself becoming somewhat less Democratic in the process. I’m making a bit of a hash of communities of interest creating a district that runs from Eastern Avenue in Takoma Park to the Pennsylvania border, but it does reflect the expansion of suburb-type concerns into at least the middle section of this proposed district.
Incumbent Van Hollen is taking one for the team here, adding a little more deeply red turf in Carroll and Frederick Counties. It shouldn’t be of much consequence; a D+9 district or so like this one should be plenty safe enough for a competent Dem. A Republican would have beat normal GOP performance here by double digits to even have a chance at winning, a tall order, especially considering the way that closed GOP primaries are likely to favor rural arch-conservatives (the numbers for the Frederick/Carroll/Howard portion of the district are pretty similar to those in MD-01) who are going to get crushed in Montgomery, which is home to about 74% of the district’s electorate.
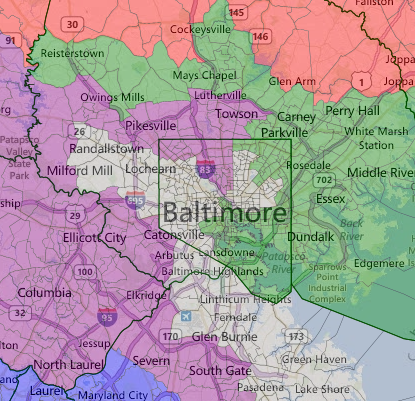
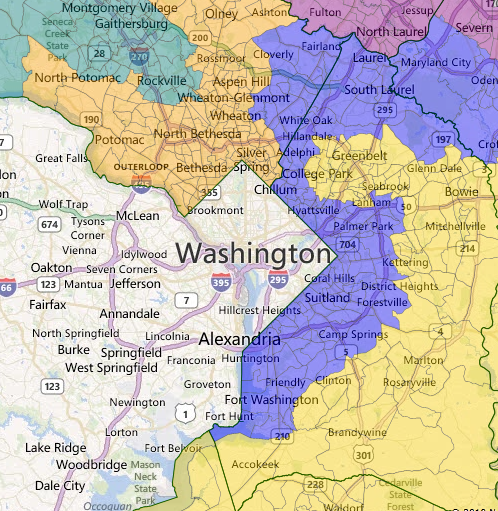
In conclusion, here are the closeups, one of Greater Baltimore, the other of the DC suburbs...