While not an update to the app itself, there are a couple of new things available for DRA that may be of interest to people here. For those of you who don't know, Dave's Redistricting App is a free app that lets you draw your own congressional/legislative district lines.
In this update, I've made available my template for easily presenting DRA statistics in a nice logical table. Additionally, it includes county-level (and town-level for New England) statewide election results for every partisan D vs. R race since 2006 to present including 2004-2012 president for every state except Alaska. While nearly every state currently has 2008 president by precinct, only a few have good numbers for downballot elections and some such as Arkansas have no data whatsoever. As such, you can easily use this data to calculate partisan numbers when you draw districts that are relatively free of county/town splits and I'll show you how over the fold.
Partisan Data Template
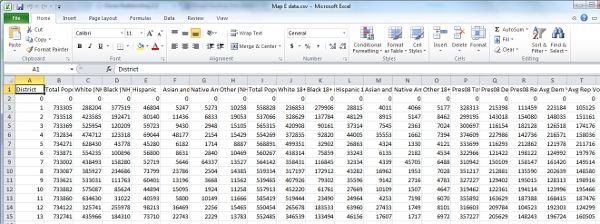
The purpose of this template is to quickly and effortlessly turn your CD data .csv from DRA into an organized and presentable table with excel that you can turn into a .png or other picture file to upload and share.
Thus, with a few clicks you can turn one of these:
Into one of these:
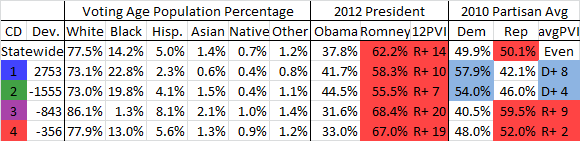
Starting from left to right, the main table displays data that is typically included in redistricting diaries here:
-CD number, color coded using DRA's standard coloring
-Population Deviation from Ideal
-Voting Age Population percentages, colored-coded if a minority group is over or whites are under 50%. The colors are according to DRA and are gray for majority minority, blue for Blacks, green for Hispanics, purple for Asians, and yellow for Native Americans.
-Obama/Romney (or McCain) two party vote percentages, colored by winner
-2012 PVI (or 2008)
-Partisan Average percentage, colored by winner
-Partisan Average PVI comparing districts to the statewide average
How to use the template
1. After you have saved your DRA file CD data as a .csv (like the one previously shown), copy the data from that .csv and paste it next to the district numbers in that empty middle section of columns. The template will automatically produce the statewide totals, so make sure you start with district 1.
2. Select the number of districts you want, from 1 to 499, in the green field just next to the main table. This will determine the deviation (rounding if necessary), which I usually try to keep between +/-1000 so you might change the column margin if you have different parameters.
Your main table on the left should now be completed. If you are using this table for a redistricting diary like I do, all that is left is to copy and paste the data you want into a program such as paint (I use GIMP) so you can upload it as an image and share. All of the columns (A through P) from CD to avgPVI are 580 pixels wide to fit within DailyKos limit of 600 pixels for diaries. If you want to use one of these tables for comments you'll have to change the widths or insert width="500" in the html code.
You can find the table available as an excel file for download using Google docs. The default is for 2012, but I've included both the Obama/McCain national numbers as well if you want to swap them in and use 2008 instead (you'll obviously want to relabel Romney as McCain and 12PVI as 08PVI).
County and Town Election Data
This is mostly useful for 2012 presidential data or states like Arkansas that either have no partisan data on the app and/or are also states where local performance diverges significantly from presidential performance. Additionally, it's also really only useful for states where you wont have significant county splitting like Arkansas, but even for states like Illinois you could look at the few districts that won't split a lot of counties.
Here's the the data itself by state available as an excel file for download via google. These are the same files I used to calculate partisan averages for counties, so the page with the actual election data will typically be on the second page titled "County Races."
The easiest way to make use of this data depends on the state you're using. For a state like Arkansas, once you've drawn your districts the easiest way will be to use the "save VTD data as .csv" function on the app (not CD data as .csv). Then, open the .csv file, copy the column with district number and paste it right next to the one with county name. Then, highlight all of the cells in the two columns and use excel's Edit: remove duplicates function found under the data tab. Now you'll have all the counties with the appropriate district numbers. Then, take them and paste them next to the county names on the sheet labeled County Races in state file I've uploaded (you may have to create a new column first). Then, select all of the election data by county and sort the group smallest to largest by the district number. Now you can use the subtotal feature with the district number as the group and use the sum function on it and you should be left with the total election numbers by district. Annoyingly, excel won't put this summary on the clipboard unless you copy them, paste them into another program like Notepad, and then copy them back to excel, otherwise it just copies the underlying numbers (such as the multiple county numbers per district).
For some states or a particular district by itself with just a few counties it might be easier to calculate the district numbers by simply inserting a new row below the elections data on the County Races page and simply add up the data by county and then drag that cell all the way right. You can use this method for New England if you're particularly masochistic, but I highly discourage it. Instead, since the town name is what you want to organize by, you'll have to take an additional step once you've saved VTDs by .csv. Voting Districts in the App are generally the town names plus precinct/ward number. What you'll have to do is use the replace all function on excel to remove the "precinct 1" etc. suffix; also watch out for any "Voting District Not Defined" precincts. Then you can use the subtotal function to average the district by town name like you would for counties previously. Make sure though, that the town names match up with the list on the Town Races sheet when you transfer over the numbers, otherwise your data won't match.
I hope this wasn't too confusing of an explanation for either of the two. Enjoy!

