Now that DKE has completed calculating the presidential votes in all 435 congressional districts, I wanted to revisit my previous diary where I mapped out the presidential and house races by district. I've included both the presidential swing and PVI trend and used a new color scheme for the presidential and house races by district and the spread between the two by district. Additionally, while the data is based upon estimation, I've mapped out the binary winners of the senate elections by the 2012 CDs for 2006-2012. So follow me over the fold if you like maps.
(click through for large image)
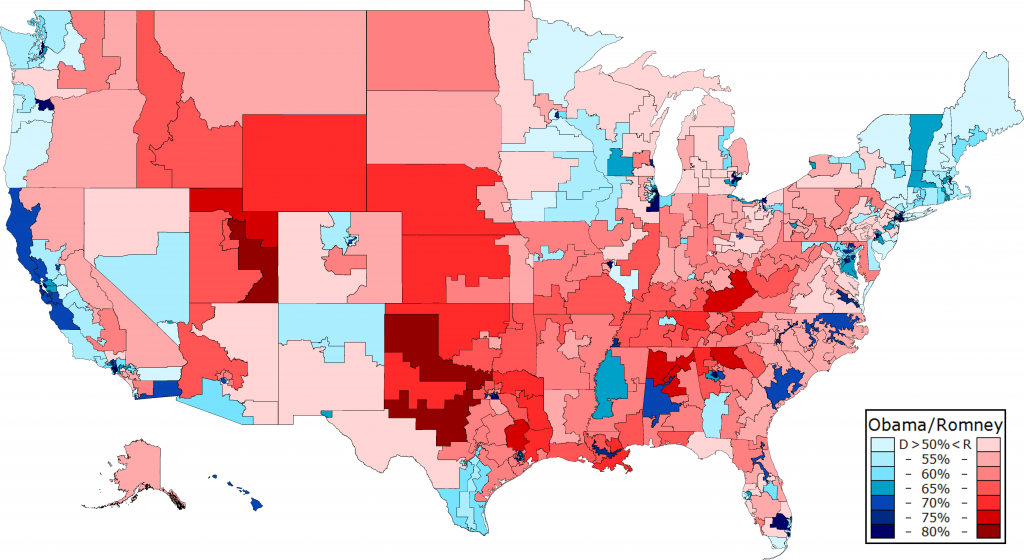
First up is the presidential election by district with data courtesy of Daily Kos Elections. All election margins are two-party only. Obama carried 209 districts to Romney's 226. 195 districts were more Democratic than the nation at large, while 240 were more Republican. The median district was WA-03 (Jamie Herrera Beutler-R) at R+2.8, which should give you an idea of how hard it will be for Democrats to retake the house anytime soon.
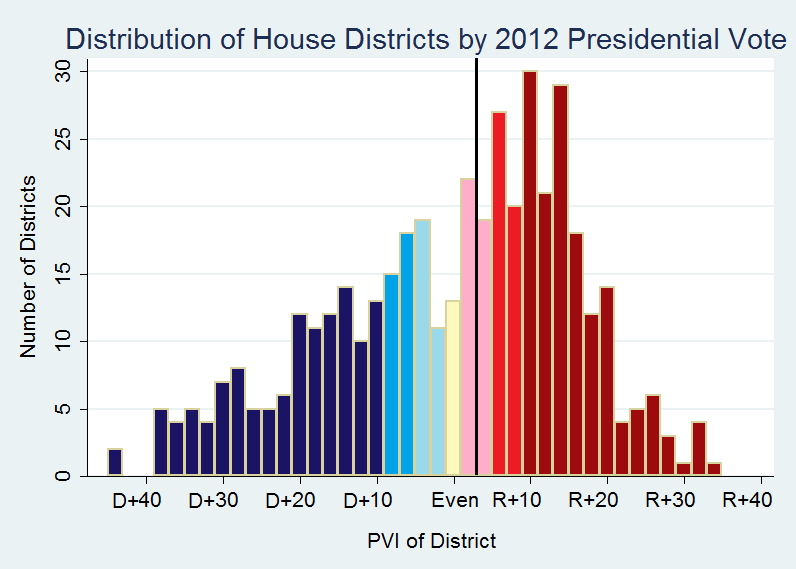
Here's a histogram of the above map with the districts sorted by their 2012-cycle PVI. As you can see, the black line representing the median is firmly on the right side of Even. Roughly half of all the seats were within D/R+11 or so, though the standard deviation was quite large at ~16. As should be obvious, the distribution is skewed to the right with a skewness of .470.
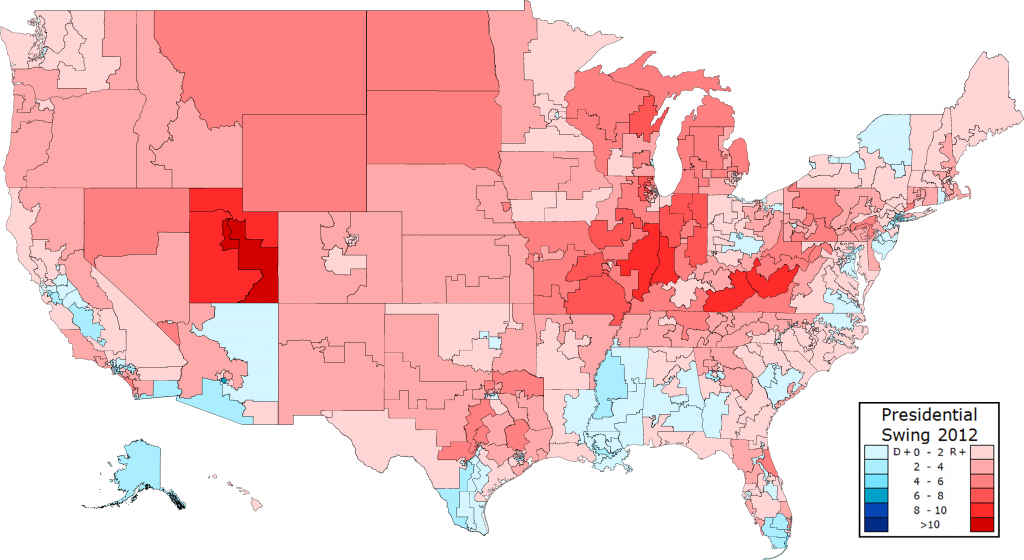
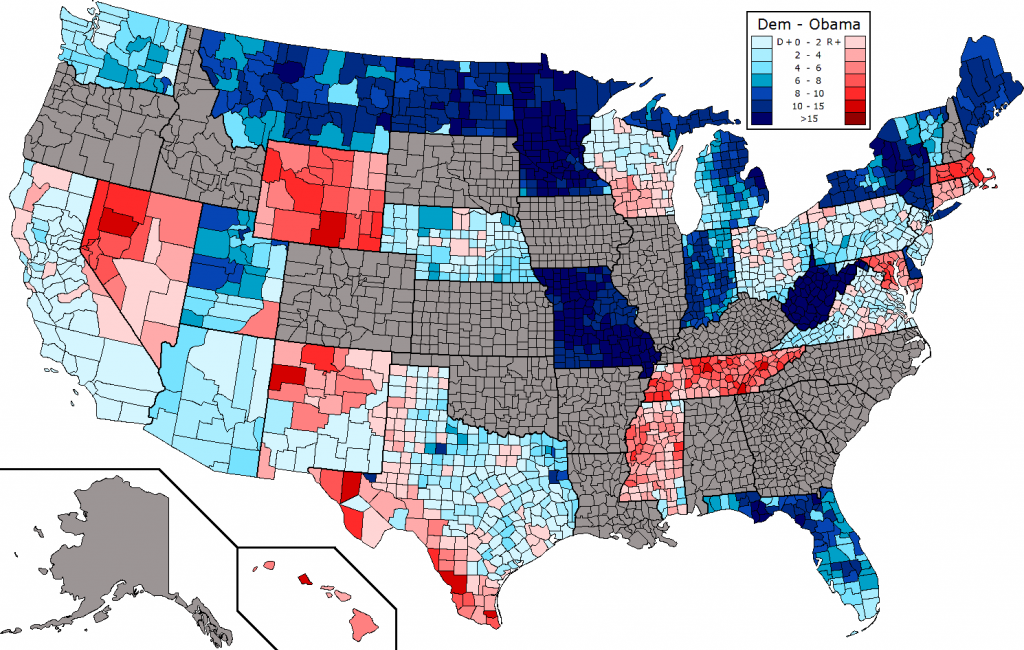
Next is the 2008-2012 swing. a lot of Romney's improvement over McCain occurred in the midwest, particularly in states like Indiana which Obama didn't contest. Romney also improved considerably in mormon heavy Utah, but also in Appalachia and the mountain west in general. Obama saw his biggest improvement in heavily non-white districts such as those in south Florida, New York and New Jersey, and California.
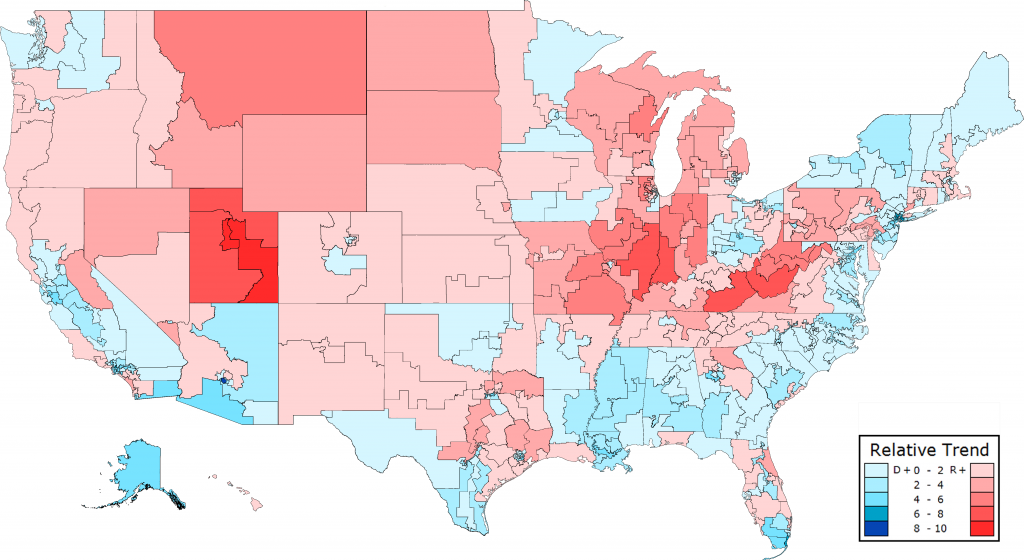
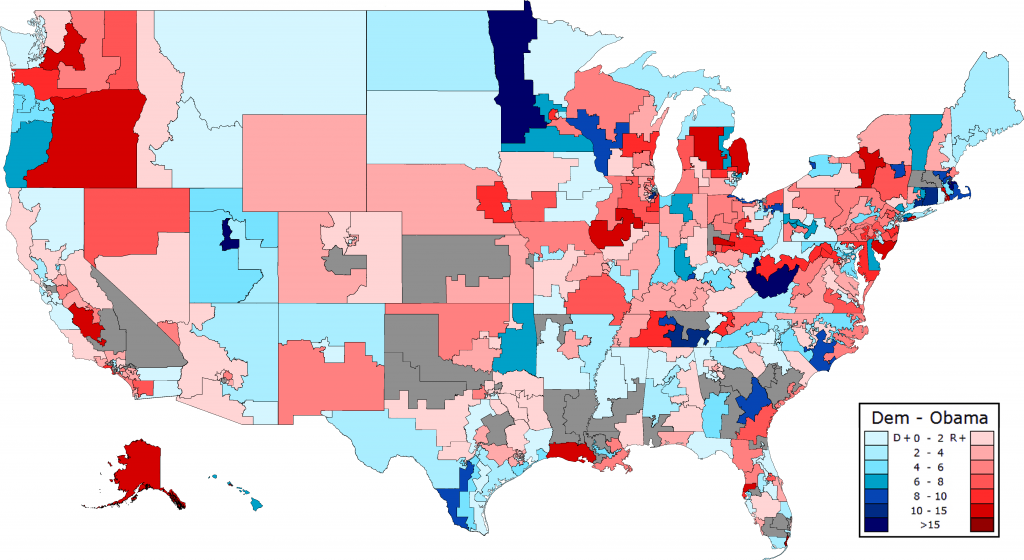
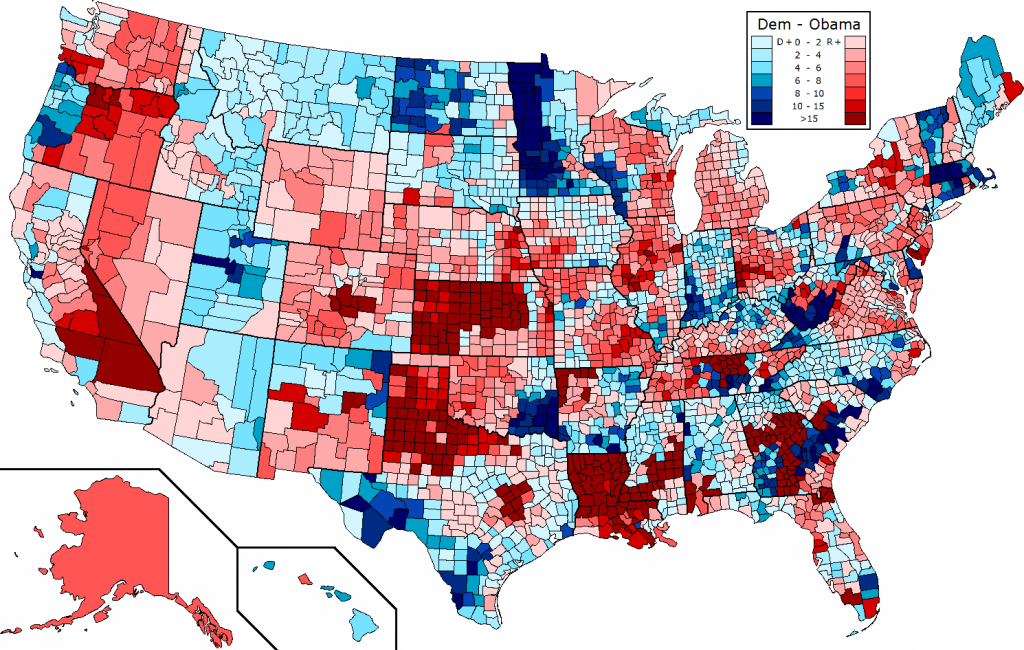
Here is the change in the one-cycle PVI from 2008 to 2012. The fastest R trending districts were again in Utah, Appalachia, and parts of the midwest. Much of California, the Deep South, and the eastern seaboard trended Democratic.
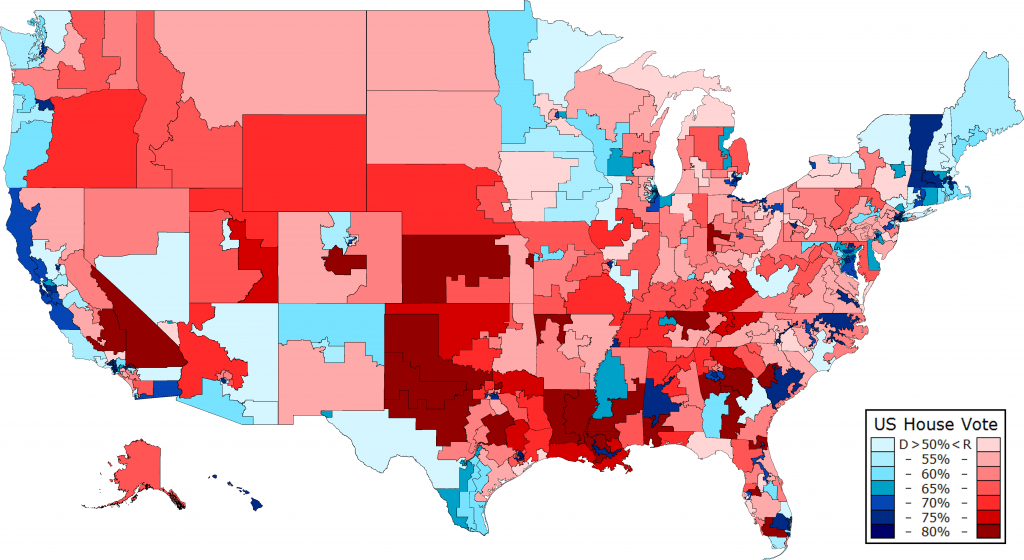
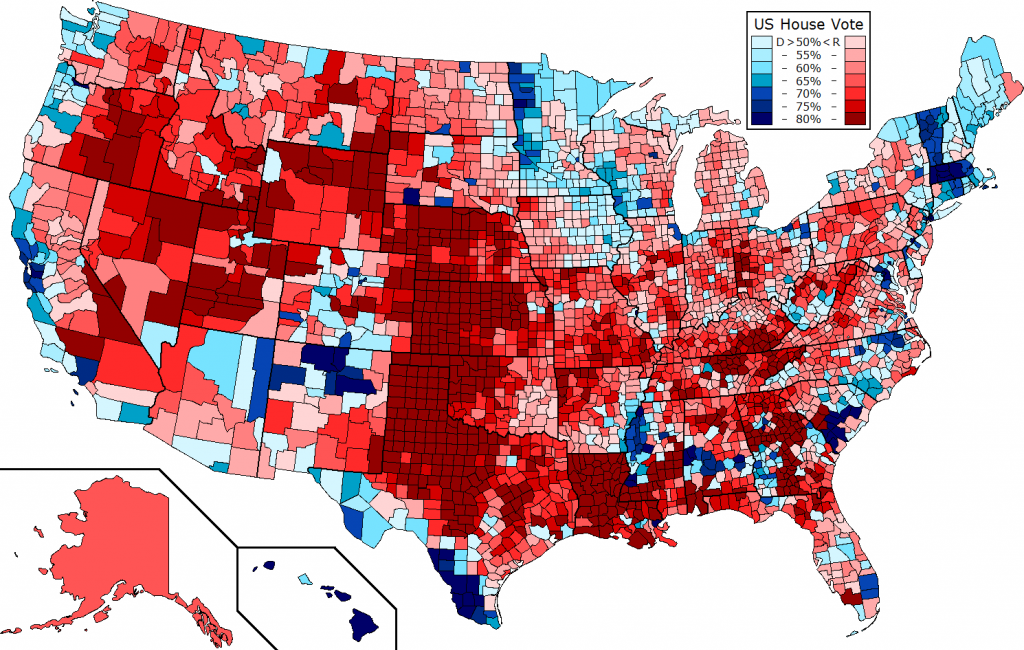
Looking at the US House of Representatives vote, one thing that sticks out is how many darkly red or blue districts there are; these were largely uncontested by one of the major parties, though some incumbents in heavily minority districts were actually able to crack 80%. Overall Democrats won the two party vote 50.6 to 49.4. When you look at how candidates fared in all of the contested districts compared to the presidential ticket and extrapolate that out to the uncontested seats (an imperfect method, I know), the popular vote would be closer to 51.2% Dem, 48.8% Republican which is more consistent with the generic ballot portion of the polls that were the most accurate in forecasting the presidential popular vote.
Moving on we come to how the House candidates did compared to the presidential ticket. In general, Democratic candidates won roughly 94% as many votes Obama that did while Republicans won roughly 97% as many as Romney did.
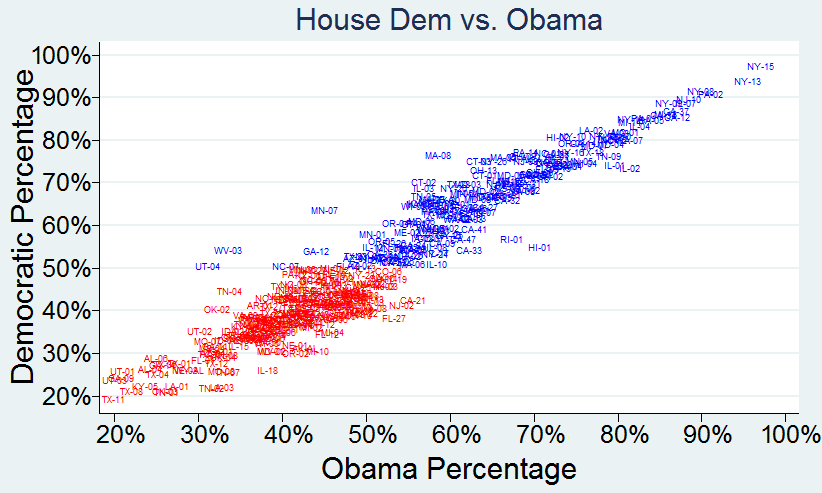
Graphically you can see there was a very strong correlation between the presidential and house vote percentages, with the r-squared value of .908.
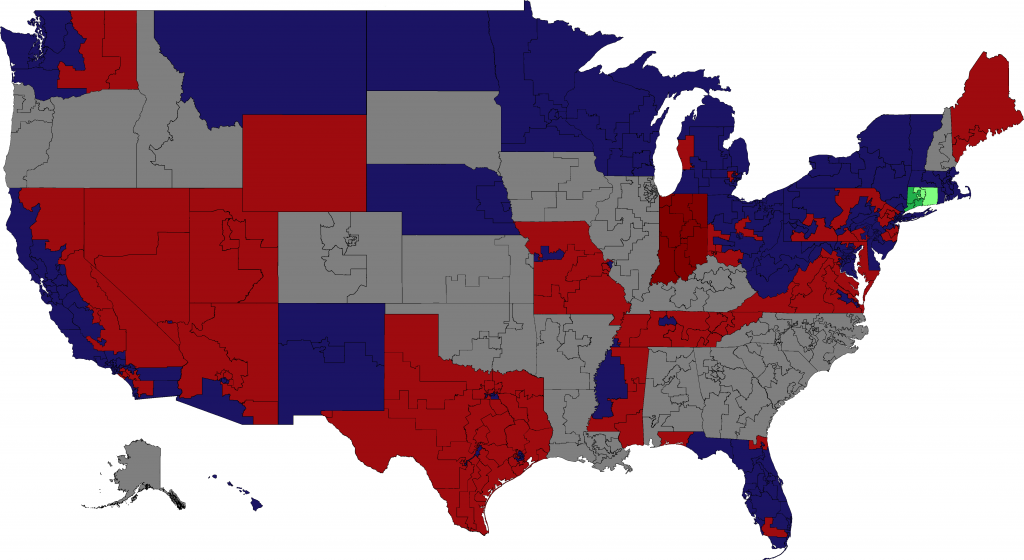
Here we have the binary winners by district for the 2006 election. Notice how we utterly dominated in the upper midwest, northeast, Florida, and the West Coast. The green in Connecticut represents Joe Lieberman's majority win in the west and plurality win in the east. Dick Lugar was unopposed by a Democrat in Indiana. Very surprisingly, Kay Bailey Hutchison won nearly all of the south Texas districts and even the 16th covering El Paso. The most amazing democratic win though is probably Ben Nelsons in NE-03 which is ridiculously Republican.
The 2008 map also shows some dominating victories for Democrats with several statewide sweeps, particularly impressive of which is Dick Durbin's win in Illinois and Mark Warner's win in Virginia. Mark Pryor was unopposed in Arkansas.
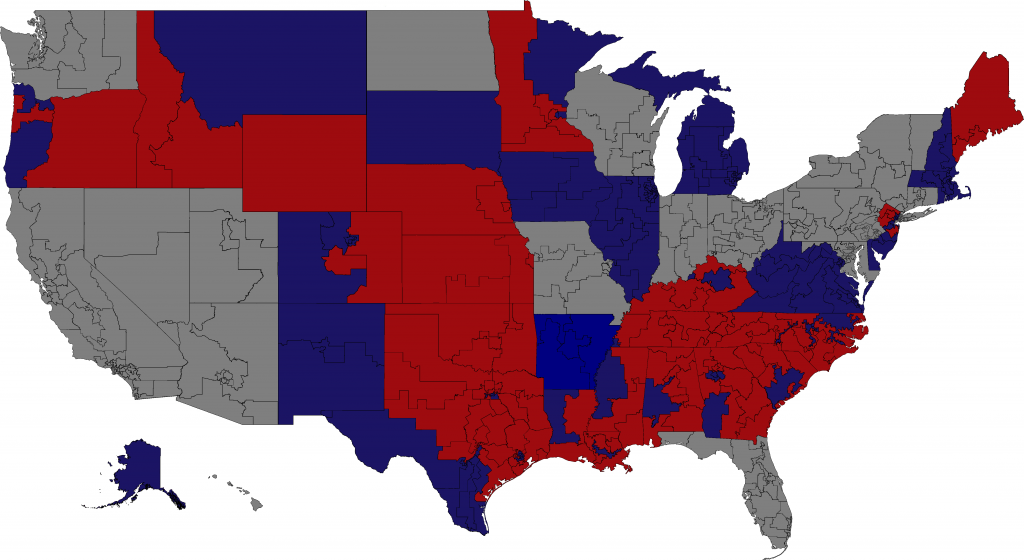
And here comes the red tide of 2010. Democrats in West Virginia, New York, and Connecticut all managed a total sweep, but Republicans did the same in New Hampshire, Iowa, Kansas, Arkansas, Oklahoma, Utah, and Idaho. John Thune in South Dakota was unopposed. In Florida the medium red represents Marco Rubio's plurality win while the medium blue and green represent Kendrick Meek and Charlie Crist, respectively.
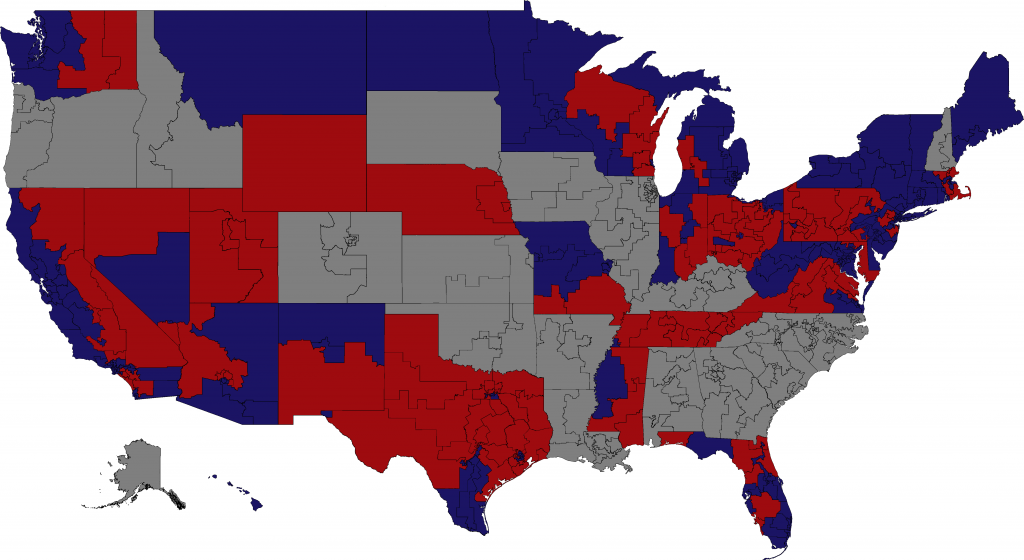
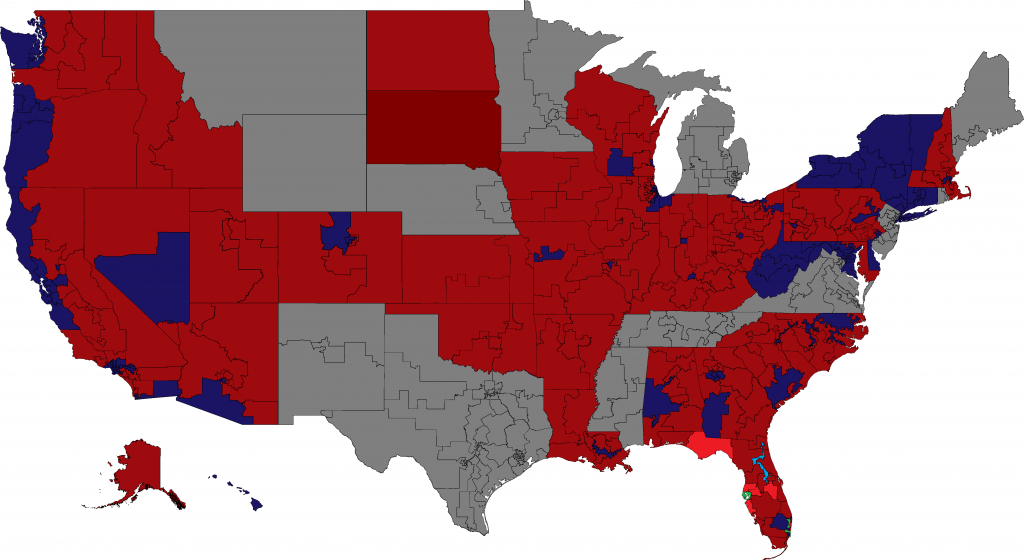
Finally we have the 2012 map which brings back a considerable amount of blue. Kirsten Gillibrand again managed an all district sweep, as did Joe Manchin, Amy Klobuchar, and Chris Murphy. Claire McCaskill also performed very well and even carried Akin's old congressional district. Impressively, Bob Corker managed to carry TN-05 which hasn't sent a Republican to congress since Reconstruction.
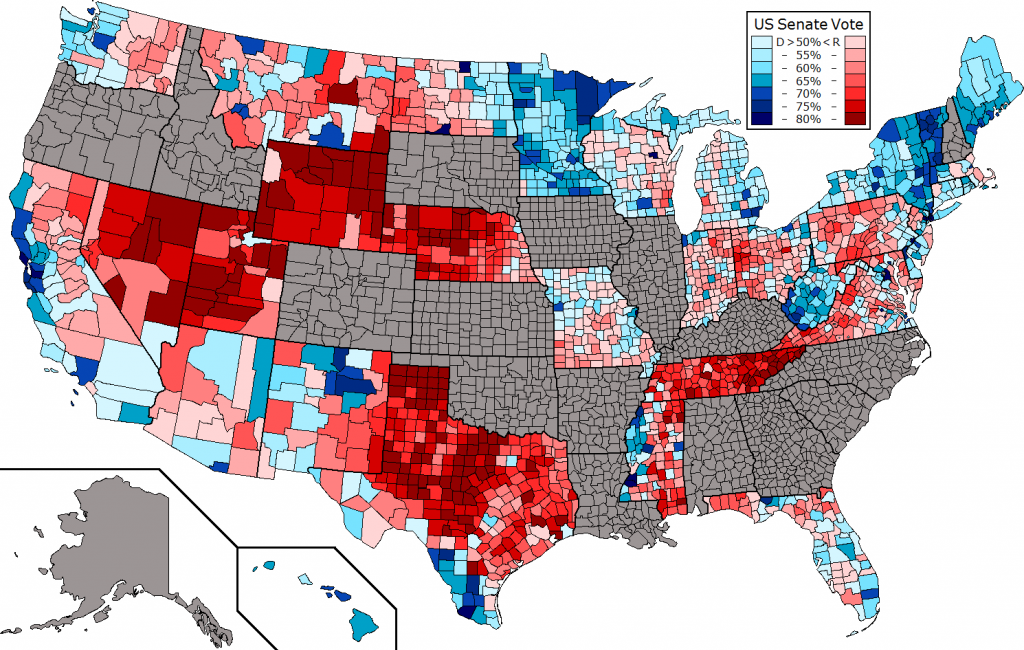
And here's the senate elections by county. Senate Dems ran significantly ahead of Obama in many areas, particularly in states like Missouri, Minnesota, and West Virginia.
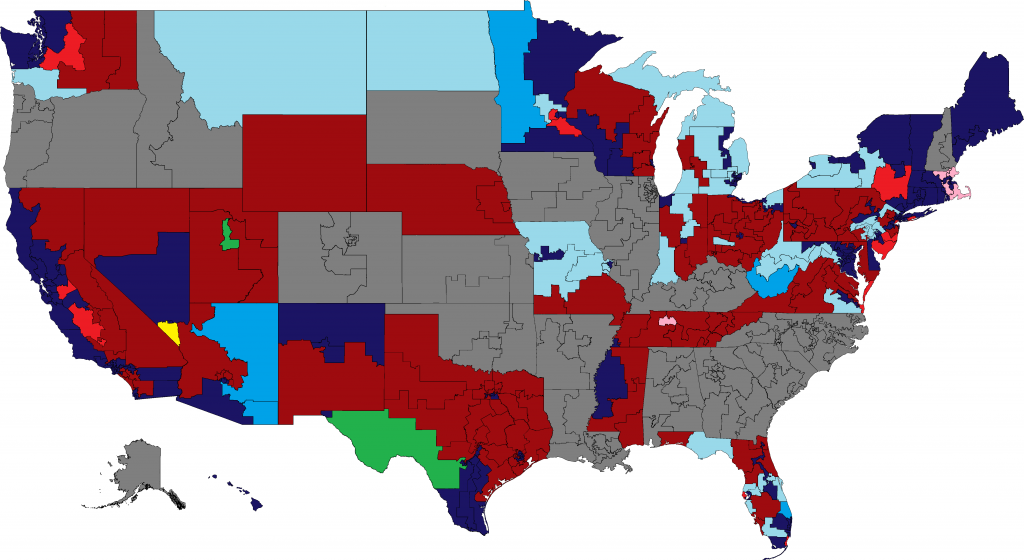
This last map shows which districts split their tickets last year.
Dark Red/Blue - straight ticket
Medium Blue Romney-Dem-Dem
Light Blue Romney-Dem senate-GOP house
Green Romney-GOP senate-Dem House
Pink Obama-GOP Senate-Dem House
Medium Red Obama-Dem Senate-GOP House
Yellow Obama-GOP-GOP

