Following the 2012 elections, North Carolina saw its first Republican-led one party government since Reconstruction. Thanks to their control over the redistricting process, Republicans were able to gerrymander the state legislature so effectively that they now have veto proof majorities in both chambers, not that newly elected governor Pat McCrory would veto their agenda. Despite electing McCrory, North Carolina didn't see some massive Republican landslide statewide, but rather gerrymandering, or the drawing of political districts to strongly favor a particular party, enabled them to win sizable majorities. Six months into Republican-led government, Pat McCrory has seen his popularity tumble to where his approval rating is no longer positive. The Republicans in the legislature are horribly unpopular and while the Democrats don't have that great of a public image, the disparity is enough that the generic ballot asking whether poll respondents favor one party over the other in general has consistently found Democratic leads.
However, given how extreme this gerrymandering is, it is still a daunting task for Democrats to win either chamber of the legislature despite how unpopular Republicans get. So let's take a look at the 2012 elections and why the results give us ample reason to believe it will take a massive statewide lead for the Democrats for them to take either chamber starting with the state senate.
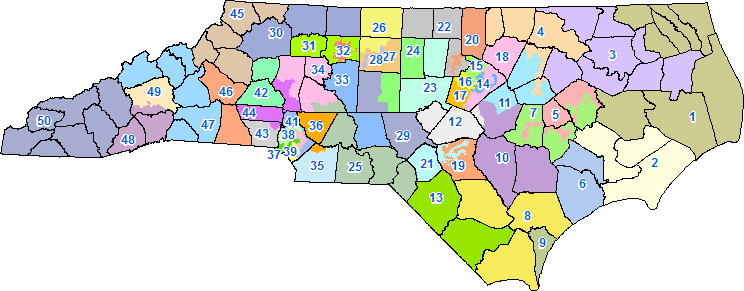
For reference these are the 50 state senate districts. You can find more detailed maps here.
Democrats had long controlled the North Carolina Senate as many conservative Democratic parties had done for generations in the South. However, like many legislatures including the US Congress, Senate Republicans made massive gains in the 2010 landslide and wrested control from the Democrats for the first time since Reconstruction. Since 2011 was a redistricting year and then governor Bev Perdue had no power to veto, the General Assembly's Republicans passed an aggressive gerrymander of the legislature. The previous map used in the 2004-2010 elections was drawn as a compromise between the then Democratic Senate and Republican House and was by most regards a fair, non-partisan map. After the 2010 elections, Republicans held a 31-19 edge in the chamber with this map.
Now let's look at the 2012 elections. The Republican party was able to flip 2 Democratic held seats while some both parties lost two districts in redistricting but had them reappear elsewhere. Republicans netted 2 seats total for an expanded majority of 33 to 17. As should be very obvious from just a quick glance at some districts like the ones in Fayetteville, Greensboro, Raleigh, Charlotte, etc, Republicans had no qualms about gerrymandering. However this map isn't nearly as aggressive as it theoretically could be since North Carolina's state constitution prohibits excessive county splits and the original 2002 map that Democrats had passed was struck down for that very reason. Now let's take a look at these districts by the numbers.
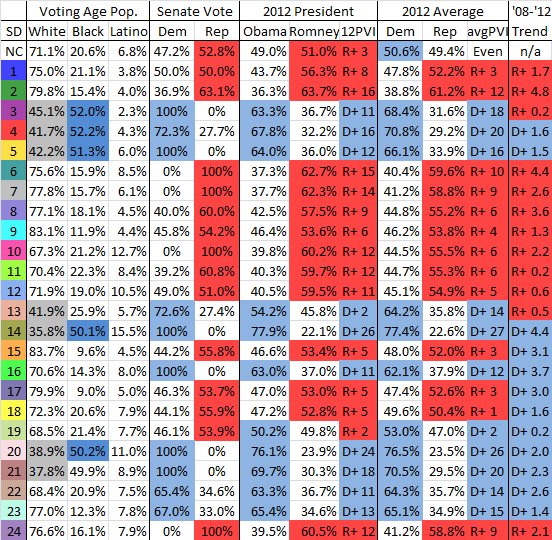
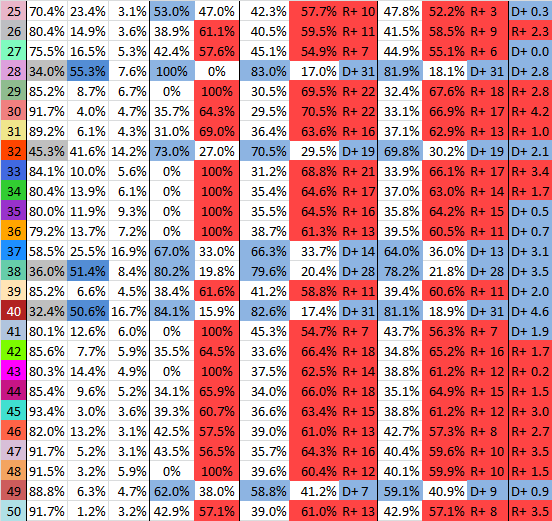
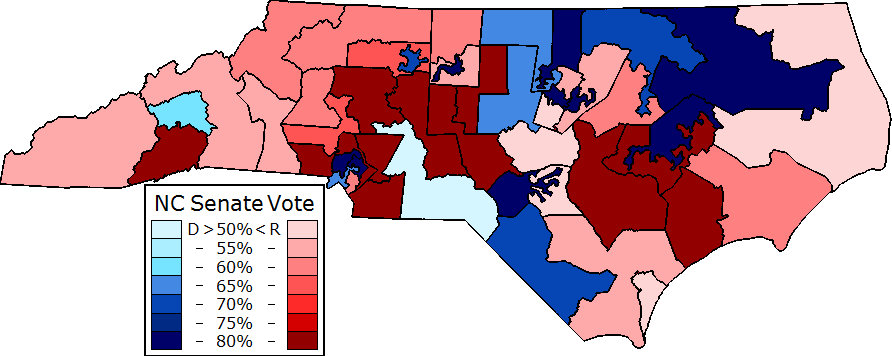
Here I've given the district demographics from the 2010 census, the two-party only state senate vote (all election data will exclude 3rd parties), the 2012 presidential vote, the 2012 PVI (Partisan Voter Index), which measures the percentage point difference between the district vote share and national vote share, the 2012 average of the 9 statewide executive races such as governor, and the average PVI with the state as a whole being evenly balanced (though 50.6% Democratic). Looking at the demographics of the state, we can see that 10 districts are over 40% Black while an 11th is majority minority and the remaining 39 are white majority.
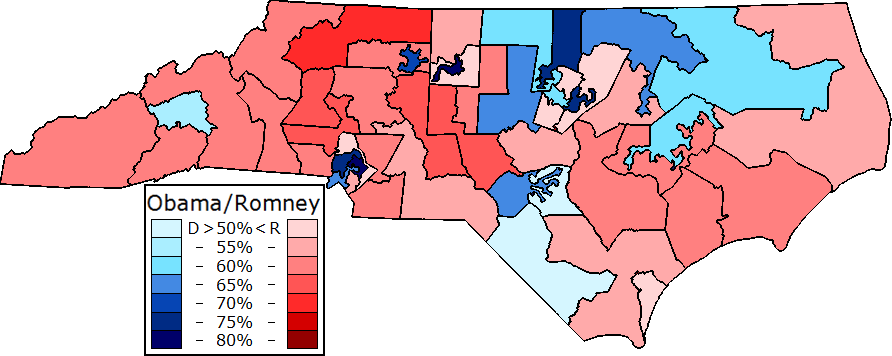
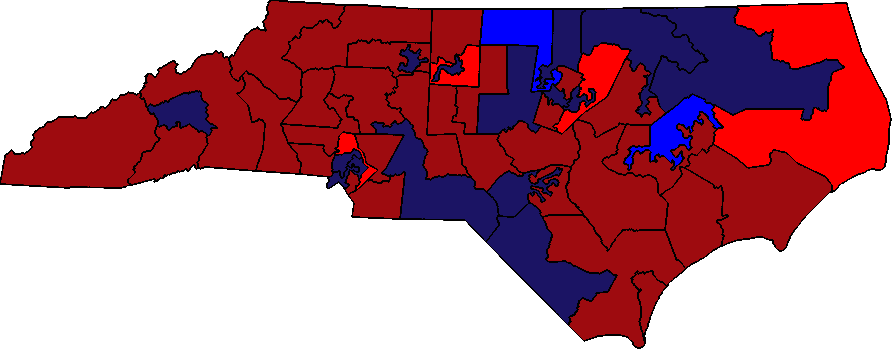
Here we have the 50 districts mapped out by the 2012 presidential vote. Statewide, Romney won by 2% yet here it should be easily seen that he won the vast majority of the districts. Notably, there are very few districts where Romney won over 65% of the vote yet there are several that Obama won by a greater margin. In total, Romney carried 33 districts to Obama's 17.
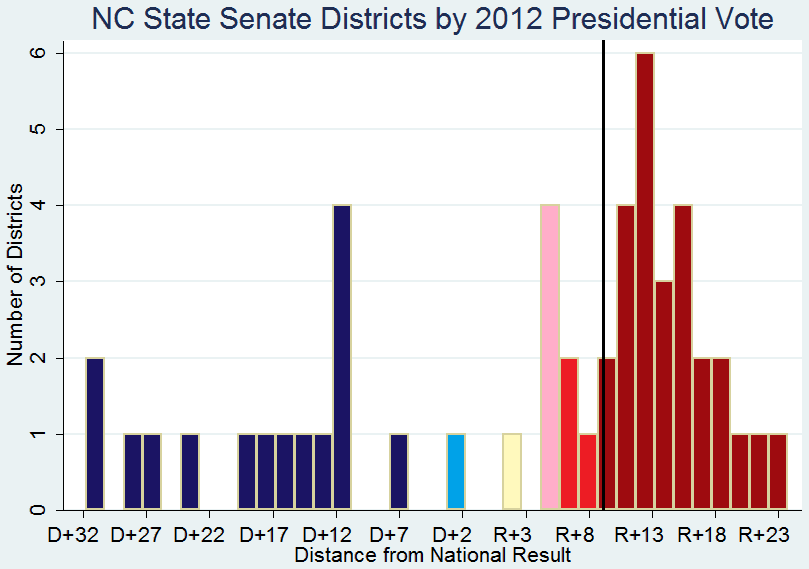
Where you can really see the Republicans' built in advantage is in the graphical distribution of the senate districts. The state was 3% more Republican than the nation as a whole so I've set R+3 as being evenly split between the parties with those districts to the right more Republican and those to the left more Democratic. The black vertical line represents the 26th least Democratic district, indicating the number that Democrats would need to win to flip the chamber or Republicans to hold it given the Republican Lt. Governor's tiebreaking vote. The vast bulk of the districts are to the right of the state with the median being R+9.7, or 6.7% to the right of the state. Under the previous map, the 26th district was a considerably lower R+7.4 and the 25th under those lines, which would have tied the chamber in the absence of the Lt. Governor, was just R+5.8.
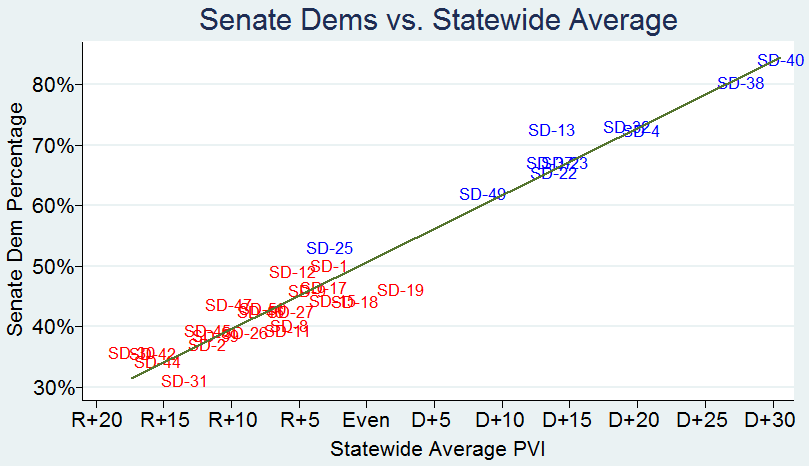
Local candidates don't always perform in line with the presidential result though so it's worth looking at another metric of performance that we can eventually compare the senate candidates to. Concurrent with the presidential election, North Carolina held elections for 9 statewide executive positions (Attorney General was uncontested by Republicans). Republicans won the positions of Governor, Lieutenant Governor, Agriculture Commissioner, and Labor Commissioner while Democrats won the positions of Secretary of State, Treasurer, Auditor, Schools Superintendent, and Insurance Commissioner. Overall the average of the 9 races statewide went 50.6% for the Democrats, even closer than the presidential election. Here's what the 50 senate districts look like when you compare the district by district average to the statewide average:
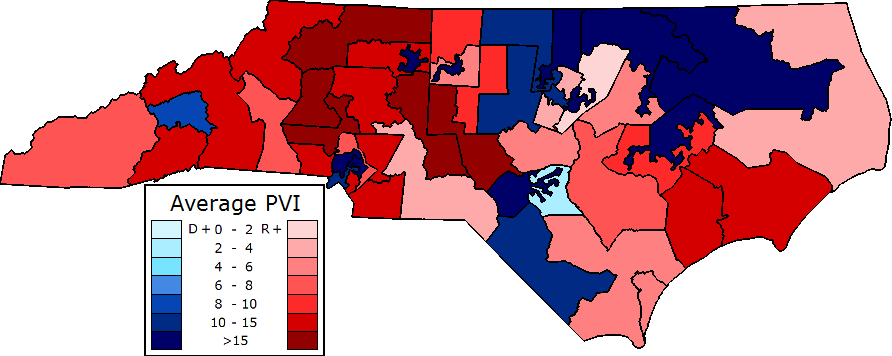
Though I've narrowed the scale here, you can still see that most districts have a Republican advantage and only a handful are really close to the statewide average. Again looking at the distribution we get a clearer picture of the map's Republican bias:
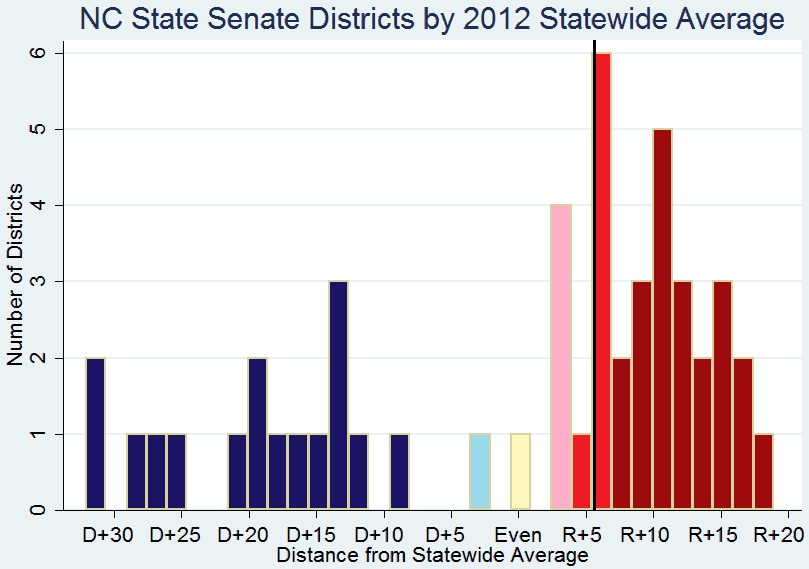
Things barely look any better for the Democrats here than they did with the presidential results as the bulk of districts favor Republicans and the majority does by a considerable amount. The 26th district here is R+5.7 compared to the state whereas under the previous map it was a much lower R+1.9, a crucial difference.
So we've looked at the 2012 data mapped by everything other than the senate elections themselves. Here I've mapped out those results with races uncontested by one of the two major parties appearing as the darkest colors:
Only 6 races were within 10% while only two were closer than 5%. A whopping 19 districts out of 50 were uncontested by one of the two major parties. Overall, Republicans won the popular vote by about 5.5%, but this is entirely due to the fact that there were far more uncontested Republicans than uncontested Democrats. In attempting to control for this factor, I measured the performance of the parties in the districts both had contested compared with those districts' presidential and average performances. Applying this data to the uncontested seats under a variety of different methods (which showed little difference) resulted in a Democratic popular vote win of 1%. Though gerrymandering probably didn't make the difference given such closeness and Democratic voters' higher geographic concentration, it is still astounding that the Republicans were able to essentially take a 1% loss and translate that into 66% of the seats in the chamber and is a testament to the power of gerrymandering.
Before we can begin looking at what 2014 might hold there are several more sets of data that require our attention. For one thing, you might have noticed that the parties' district by district performance didn't nicely match up with presidential or even the average in certain districts.
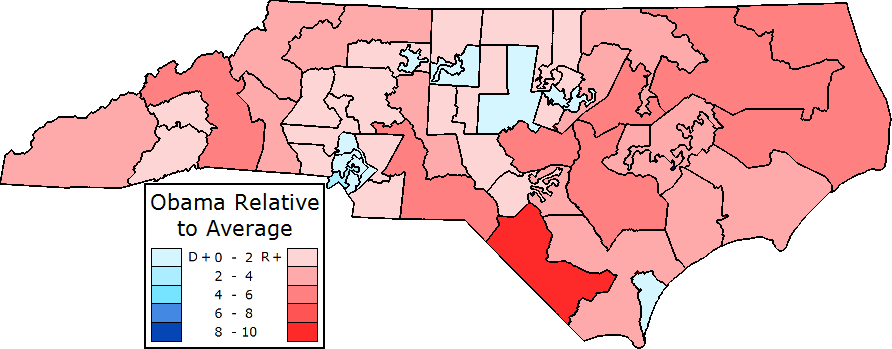
Here I've illustrated for reference the difference between Obama's vote share and the statewide average. In all of NC Obama ran 1.6% behind the rest of the ticket as a whole, but he ran ahead or even with it in all of the more urban and suburban districts in the Triangle, Triad, and Charlotte and even Wilmington while he ran behind it the most in rural eastern North Carolina. While that region as part of the national Black Belt region has a large rural black population, it has for generations been the bastion of white conservative Democrats, a demographic who have been voting Republican for president for a several cycles now and it is no surprise that Obama would underperform the ticket there.
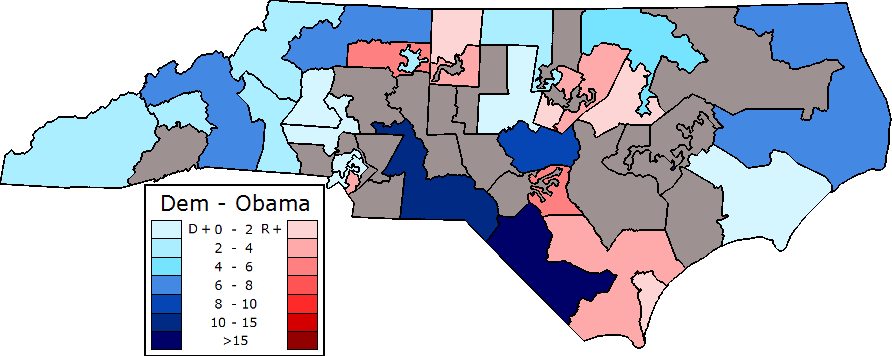
In this map I've subtracted Obama's vote share from the Democratic candidate with uncontested seats in gray. What we generally see is the Democrat running far ahead of Obama in many of the more rural districts while running behind in some of the more suburban or heavily white urban ones. Incumbency also plays a role as the few rural districts where Republicans ran ahead of Romney, they had incumbents. Overall, the r-squared value for the comparison of Obama and Senate Democrats was .89 which is quite high but not perfect.
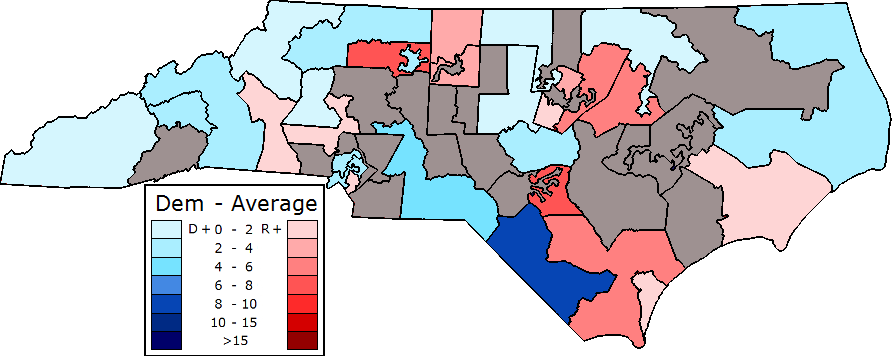
Taking a look at the Democratic candidate compared to the statewide candidates' average, we see a map that has a little less disparity. Democrats still run ahead in the rural districts for the most part because they're more conservative than the statewide ticket while Republicans tend to run ahead in the more suburban ones due to incumbency both their own and that of the majority Democratic incumbent statewide officeholders. Overall, the r-squared was .95 which is very high. As such, I prefer using the average as a means of gauging a district's relative competitiveness though the presidential numbers aren't without merit.
You can see how clear this relationship was though a few districts stick out where the winner performed above what we might expect on paper. For every point decrease in the average PVI, the Democratic candidate saw a 1.1% decrease in vote share on average. Now that we've analyzed the districts and investigated what data can serve as a useful indicator of performance, let's take a look at how 2014 might shape up.
One logical place to look in our search for which districts might change hands would be those that were the closest in the preceding election. However, not all districts have the same fundamentals and just because a race was close one year doesn't necessarily mean it will be close the next. Let's take a look at some of these changing fundamentals and how they will impact 2014.
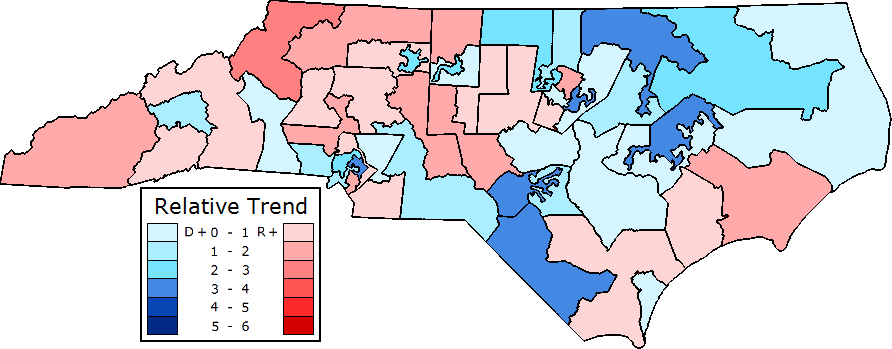
This map looks at the change in the presidential PVI or the relative change in the distance from the national result among each of the districts from 2008 to 2012. The state as a whole trended about 1 point Democratic and here we see that those districts in places like Charlotte, Raleigh, or northeastern and southeastern NC, nearly all of which have significant minority populations, trended Democratic the most. Those that were the whitest such as in western NC trended Republican the most but surprisingly so did a few white majority districts in places like Mecklenburg and Wake Counties.
For the most part, this trend is a net negative for the Democrats and positive for the Republicans and while a few districts might reverse such as those in Mecklenburg or Wake, it is highly unlikely that the rural white majority districts won't continue to trend Republican as they have done for several cycles now.
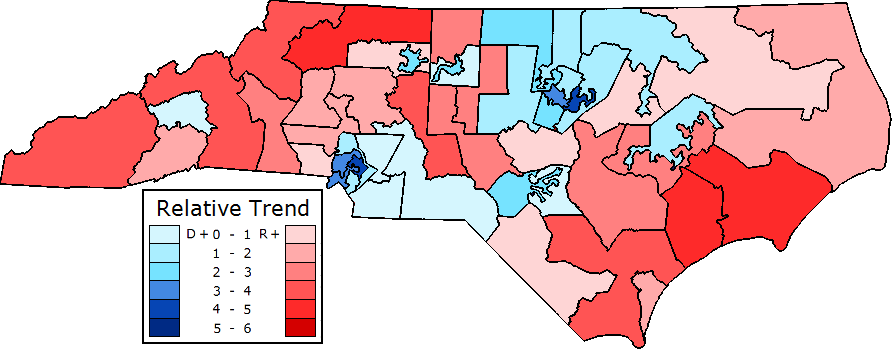
Above though we saw that the presidential performance was a slightly inferior metric than the statewide average in trying to predict senatorial performance. This map shows the districts by the relative change in their statewide average PVI, or the change in the distance between the district average and the state average over 2008-2012. Again we see all of the urban/suburban districts trending Democratic aside from Wilmington while even here the black majority rural ones are neutral at best for the Democrats. Even more pronounced though is the Republican trend of nearly all of the rural white majority districts, particularly in the southeast and the mountains.
Even more so than the presidential trend, this map is a very clear net positive for Republicans and shows the ingenuity of their gerrymander. While there are several districts that saw a significant trend towards Democrats, nearly all of them are currently held by the Democrats and are designed to pack in as many of their voters as possible in places like Charlotte, Raleigh, etc. Unlike in the presidential trend, we can pretty clearly see that just about all of the suburban Charlotte and Raleigh seats are trending Democratic, but regardless, even if they won every remaining seat in Wake and Mecklenburg counties, Democrats would gain just 5 out of the 9 they need to win the chamber.
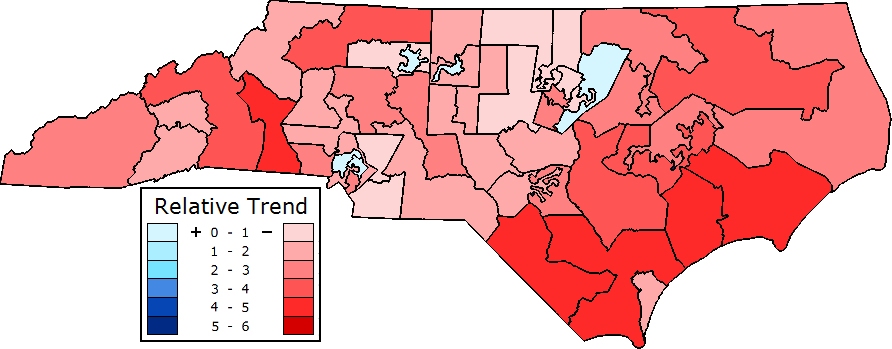
The final trend map doesn't look at relative party strength but instead looks at relative rates of ticket splitting. To make an apples to apples comparison, I've averaged the downballot statewide office vote shares and compared them to the presidential vote share in both 2008 and 2012. Districts where that difference was wider in 2012 than in 2008 are in blue while those where that difference is lower, and thus saw more of an alignment over that period are in red. As you can see, the vast majority of districts saw a decrease in ticket splitting between 2008 and 2012.
Again, this is a major net positive for the Republican party. This is because the districts where Democrats rely on ticket splitting the most, those Romney-won rural white majority districts, saw ticket splitting fall the most. This is why having a Dem-friendly or neutral presidential PVI shift in that preceding map was not beneficial to the Democrats in rural districts. Even if voters are becoming more open to Democratic presidential nominees, they still don't make up a majority of the electorate and the voters needed to win these seats are becoming considerably less open to local Democrats. This is somewhat counterbalanced by the more suburban districts, but those among them that are potentially competitive are fewer in number than the competitive rural ones.
Okay, so at this point you've probably seen enough maps and want to know what you might be able to expect from the 2014 elections. Let's take a look at polling and while I normally would caution against relying on a single polling firm, the Raleigh based Public Policy Polling was one of the most accurate pollsters across the last couple of election cycles and since they're based in North Carolina, they poll statewide once a month and give us a great trend line.
Here we have 4 different data points measuring the popularity of Pat McCrory, Legislative Democrats and Republicans, and the spread between the parties on the generic ballot test.
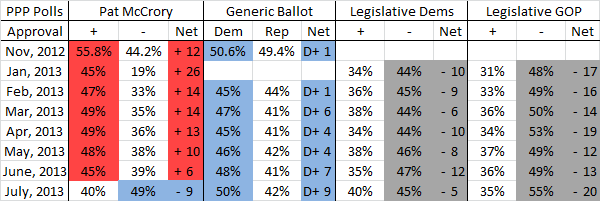
Starting from the top with the actual gubernatorial results and the uncontested-race adjusted state senate vote, you can see four trends that are quite clear. The first is that Pat McCrory, like many first term incumbents, saw a honeymoon period where his approval was far higher than his disapproval; however that is at an end. His approval has been stagnant for several months while disapproval has been rising. The generic ballot has also favored the Democrats every single time and since March by a significant amount. Next, legislative Democrats are unpopular but not terribly so. Overall they've floated around high single digits in net disapproval. However that's significantly better than Republicans who have consistently found themselves with double digit net disapproval ratings which on average are in the mid to upper teens. Given that finding it's no surprise that Democrats possess a generic ballot polling lead.
While this last poll might be an outlier in terms of Democratic fortunes (though probably not), what it and many previous polls show is that the legislation the Republican General Assembly has put forth is unpopular. Really unpopular. Opposition to the Republican budget runs nearly 3-1. Opposition to their abortion bill outweighs support for it by double digits. Opposition to their cutting off unemployment benefits for tens of thousands of North Carolinians runs 2-1. Regardless of whether the polling is a few points too rosy for Democrats those numbers are insurmountable. If Republicans continue on their current legislative agenda and all signs point to that being the case, they will remain unpopular and Pat McCrory, their lone shining star, will be tarnished.
Based on those factors and how we can expect them to unfold over the next 16 months, it is incredibly likely that the 2014 election environment will favor the Democratic party. If the generic ballot lead winds up being remotely close to D+9, Democrats will almost certainly gain several seats, but even if it is lower than that a gain is likely. Given current polling and the current fundamentals, it is nearly impossible for Republicans to make gains in the state senate. Only one Democratic state senator is in a district won by Mitt Romney and Republican on average, but this district, the 25th was not only open in 2012 but also saw the Democrat win by 6%. Republicans will not get more favorable conditions than their presidential ticket winning it by 15% and their statewide ticket by 5%. Due to all of these factors, the last segment of this diary will focus exclusively on the districts Democrats might gain and whether or not that may be enough for senate control.
First though a major caveat to this analysis is that I am by no means an expert on individual candidates and races in North Carolina below the federal level as my area of expertise is in federal and statewide politics. All of the preceding was largely based on hard numbers which doesn't require local knowledge, but given the facts readily available these are the districts where I think Democrats stand the strongest chance to gain from the Republicans.
The hands down top choice is SD-19 in Cumberland County (Fayetteville). It's the only one Republicans hold that Obama won and the only one with a Democratic average in 2012. If there is any sort of Democratic wave next year, incumbent Wesley Meredith is a goner. The other district in this tier would likely be SD-17 with incumbent Tamara Barringer in southwestern Wake County. This district is just R+3 on average and trending Democratic. Democrats came within 7% of winning last year and Obama only lost by 6%. Its electorate is also heavily white which means the Democratic base in the district will be less prone to midterm turnout dropoff than other districts with similar presidential year stats. Additionally, Wake County has seen tremendous growth and will continue to see significant amounts of new residents and voters. In the past this growth has made the county considerably more favorable to Democrats and should continue to do so.
After those seats, the choices aren't nearly as appealing though by no means out of reach. Two districts, the 1st in northeastern NC and the 12th in the center of the state saw the Democratic candidate just narrowly lose in 2012 and both are historically Blue Dog Democrat seats. While the 1st district, home to incumbent Bill Cook who won by just 21 votes last year, is trending away from the Democratic party, the 12th, represented by Ronald Rabin was fairly neutral and he won the open seat by just 2%. Should a wave happen both of these seats are somewhat close to the statewide average at just R+3 and R+5 that they might fall and are almost certainly required for a majority even though Romney carried each. The next best Democratic target is most likely SD-18 in eastern Wake County which was just R+1 and trending to the Dems. Though the current incumbent Chad Barefoot won by low double digits, this was over a relatively liberal incumbent Democrat who represented a small portion of the decidedly moderate district after redistricting. After that is SD-15 with incumbent Neal Hunt in northern Wake County. This district is just R+3 on average and trending ever more dem, but unlike all of the previous mentioned districts has a more entrenched 5 term senator. However the trend here is quite strongly in the Democrats favor and there is no reason to believe this will reverse itself as Wake County continues to see the most significant growth of anywhere in the state. Finally there is the 9th district in Wilmington which is roughly R+4 on average and where incumbent Thom Goolsby won by only 8%, though it had a slight Republican downballot trend last year. Unfortunately for Democrats, New Hanover County contains almost all of Wilmington's suburbs which combined with the retiree-drawing beach communities are quite red. This is basically the last of the districts I could see Democrats winning if PPP's D+9 generic ballot is to be believed, especially given how red some of them relatively are at R+4 and R+5.
This final set of districts was both a lot harder for me to choose and also makes me think it will be next to impossible for Democrats to retake the legislature without a double digit generic ballot lead. There are a handful of districts where the Democratic candidates did better in 2012, but these are all areas that are trending strongly towards the Republicans and are all heavily rural. The deciding factor among all the others was what in particular has been driving Republican unpopularity in the state. The swing appears to me to be driven more by urban and suburban voters signaling a change in preferences in reaction to the state GOP's focus on divisive social issues while rural conservative Democrats aren't as likely to be driven away. Thus, the final two districts are in large urban counties and have a mix of urban, suburban, and a much lower proportion of rural voters and are both heavily white and less likely to experience midterm dropoff.
Still, I don't think Democrats are yet in a position to even make both of these districts very competitive let alone win them and will need a wave of historic proportions to do so. The first of the set is SD-27 in Guilford County represented by freshman Trudy Wade. She won by 15% over an underfunded low tier opponent, but the district was a little under R+6 on average and not getting any worse for the Democrats. That's about as good as it gets and is why I think it is currently out of reach, but this would probably be a good district to run a prominent member of the local business community. The final seat is the 41st in Mecklenburg County which Democrats didn't even bother to contest in 2012. This one was the reddest of the bunch at R+7 on average but it also has a fairly consistent Democratic trend. It's also very heavily white which should lessen the midterm dropoff impact for Democrats. Like the 27th though, this is still a very tough district for them and I don't see Republicans losing it under present conditions.
To conclude, I'd just like to drive home a few key points:
- Democrats likely won the senate popular vote in 2012
- Republicans' ironclad grip on the legislature is solely due to gerrymandering
- Democrats will need a massive level of public support to win under this map
- Republicans are in a great position to keep the legislature for possibly over a
decade because the strongest Democratic growth is in Democratic held districts
- Democrats are almost certain to gain seats, but probably not the 9 they need
If you're interested in any of my data it is publicly available here. All 2008 election data was from the General Assembly itself while the 2012 data was courtesy DKE's jeffmd.

