Embedded Content
In November 2012, the American electorate voted to give Democrats unified control of government. President Obama won re-election with a majority of the vote, Senate Democrats increased their seat count, and Democratic candidates for the House won the popular vote. However, because of the way in which districts are drawn, Republicans easily maintained control of the House.
This article is the culmination of hundreds of hours of research and work. I want to demonstrate why I firmly believe partisan gerrymandering by itself can be held responsible for Republicans keeping the House. The year 2012 was two-and-a-half years ago and Republicans clearly still would have won the House in 2014 without gerrymandering. Nonetheless, it is still relevant today, because despite the very real chance Democrats win the presidency and Senate, no serious prognosticator deems the House in play for 2016.
Past work by political scientists has aimed to show how the geographic clustering of Democratic voters is instead the cause of 2012's outcome, but this research is flawed. This work prioritizes above all else geometric compactness, defined by the minimization of district boundary length and the distance from any point to the center. This method inherently will produce a pro-Republican outlook that is not supported by other traditional redistricting principles. We should think of districts as collections of constituents, not abstract geometric shapes on a map that a computer can randomly generate.
I wanted to see what the outcome might have been if I drew the best possible map for each individual state using the free Dave's Redistricting App. Because I want to measure the partisan impact of gerrymandering, there are a few principles that must be followed. Rather than value compactness over everything else, it is paramount that these principles be balanced with respect to one another. In order of prioritization these are:
- Ignoring partisanship.
- Compliance with the Voting Rights Act's demand for majority-minority districts.
- Utilizing communities of interest like shared culture, economic class, etc.
- Minimization of unnecessary county and municipality splits.
- Geographic compactness. Not mathematically minimizing district boundary length, but drawing districts so that they don't combine disparate parts of intrastate regions.
Embedded Content
Here you will find a more detailed argument regarding these redistricting principles. Using precise 2012 precinct data, I will discuss the impact these maps might have had on congressional elections that year. Please note that all election data excludes minor party candidates for an equal comparison. Additionally, all racial demographics are given in terms of the Census voting age population (VAP) unless specified.
Obviously no map is perfect and even using single-member districts is itself a flawed way to elect a legislature. However, these maps will demonstrate how, in a year where Democrats needed to net just 17 more districts, gerrymandering likely cost them 17 to 36 seats.
 The original “Gerry-Mander” political cartoon of Massachusetts Gov. Elbridge Gerry’s 1812 state Senate districts
To begin, let's first define what gerrymandering is in our attempt to measure its impact. Gerrymandering is the drawing of electoral districts for the benefit of a political party, a candidate, or even a geographic region or socioeconomic class. Not all gerrymanders are strictly for partisan purposes and even some maps drawn by courts have major flaws.
Single-member districts themselves are not an optimal electoral system because they create winner-take-all contests. Additionally, because so many districts are not competitive, most voters are ignored for those in a handful of key swing districts. Single-member districts also disadvantage racial and ethnic minority voters, which leads to a Congress that is drastically whiter than the electorate. In today's era of partisan polarization, party matters considerably more than the individual candidate.
A better solution would be mixed-member proportional representation, which Germany and New Zealand use. Under this system, some members are elected by constituency while many are elected by a nationwide party list. Voters cast two votes: one for their district representative and one for a party. The party votes are then tallied and seats are distributed proportionally so that the overall result reflects the popular vote itself.
While not perfect, this system is superior because every voter matters the same for partisan representation. Furthermore, because seats are assigned proportionally, more than two parties are likely to be represented. Compromise between distinctly defined parties will take place rather than compromise behind the scenes within a single party. Gerrymandering becomes pointless because proportional seats will counteract it. It is also highly unlikely that one coalition can come in second but win a majority of seats as Republicans did in 2012.
Of course, we do not have this system, we have plurality-winner, single-member districts. Thus, we are concerned with the partisan bias resulting from the drawing of districts, as well as the effect of geography bias.
Frequently when discussing redistricting reform, I encounter those who think simply having a computer draw lines to be as geometrically compact as possible is the optimal solution. However, this approach is problematic for several reasons.
Since geography bias is a well documented fact, making maps as geometrically compact as possible will only exacerbate it and function as a natural Republican gerrymander. Such maps also violate the VRA by ignoring race, leading to a Congress that is dramatically whiter than it should be. Furthermore, why should we needlessly divide cities and counties whose residents share an affinity with one another?
To demonstrate why geometrical compactness is problematic with respect to municipalities, here is a map of two hypothetical cities from a political science paper by Michael McDonald, Micah Altman, Brian Amos, and Daniel Smith.

Each block in this map is assumed to be a precinct of equal population, thus there are two cities in the center-left and center-right of the map. Now imagine that we are dividing this map into two districts. The most logical way of drawing it would be to split the map east and west, with each city comprising its own district as pictured in the middle. However, a computer algorithm drawing the map could just as easily split it north and south with each city being cut in half as shown on the right. This version makes no sense, but it is just as geometrically compact as the middle iteration.
Prioritizing geometric compactness above everything else can lead to illogical outcomes such as needlessly splitting cities. Additionally, computer algorithms cannot account for a fundamentally subjective judgement when it comes to districts and regions protected by the Voting Rights Act. How would a computer determine when and how minorities need to be grouped together to prevent electoral discrimination and when they would not?
Ultimately, the concept of what is fair is itself subjective and requires human input, rather than a computer algorithm. By claiming that the algorithm is unbiased, one inserts their own bias that geometry matters more than any other criteria. It is simply impossible to remove all bias from the drawing of single-member districts, because human beings are selecting the criteria. For those who wish to read a more detailed argument, I have previously elaborated on the dangers of prioritizing compactness.
 Proposed non-partisan Virginia congressional districts. Click to enlarge
Communities of interest should be the foundation for drawing districts. This term entails the economic, geographic, cultural, and demographic makeup of the district. Combining areas that have commonality is ideal if possible. For instance, note how in Virginia the Shenandoah Valley fits almost perfectly into a single district. Even though this 6th district is quite long, keeping this distinct cultural and geographic region of the state undivided is preferable to neat, square districts.
 Proposed non-partisan Pennsylvania congressional districts.
Another example of a community of interest can be seen in the Philadelphia suburbs. Bucks County is historically left undivided, but it makes more sense to split it due to differences in class. Rather than have Montgomery and Bucks counties each anchor their own district, a north-south division creates one wealthy suburban/exurban 8th district and a 13th district that is much more middle and working class. This 13th is also very heavily Irish-American, adding another layer of cultural distinction.
We should ultimately want districts that give voice to the distinct groups of people in our country. Drawing them based on communities of interest is how to achieve that end. In addition to communities of interest, the Voting Rights Act plays another crucial role in non-partisan redistricting. Both of these can be highly subjective concepts. The VRA itself has been shaped by multiple Supreme Court cases that govern the way majority-minority districts are drawn.
The two most important of these cases were 1986's Thornburg v. Gingles and 2009's Bartlett v. Strickland. In Gingles, the court laid out criteria governing when a minority district must be drawn under VRA §2. These criteria include racially polarized voting, a compact minority population, and a majority population that votes as a bloc to deny minorities the ability to elect the candidate of their choice. This led to the first mandating of majority-minority districts in the 1990s.
Bartlett was a 5-4 partisan decision aimed at hurting Democrats. The court held that when the Gingles criteria were satisfied, districts must be able to contain a majority of that specific minority demographic among adults to be protected. However, outside of the Deep South, a district that is over 40 percent African American is highly likely to allow black voters to elect the candidate of their choice.
This decision was intended to pack Democrats into already heavily Democratic districts, much like George H.W. Bush's efforts to make seats "max black" in the 1990s. Additionally, it prevents the mandating of coalition districts between two or more minority groups. The effect has been that legislators and courts tend to draw districts with a minority population over 50 percent whether it’s a necessary threshold or not.
In places such as Chicago, Hispanic voters actually elect one fewer representative than they might have because of how the lines are drawn. Meanwhile black voters elect just one representative in Philadelphia when they could possibly have two. Still, the VRA's demand for majority-minority districts is extremely important because racially polarized voting is prevalent in America.
Aside from communities of interest and the VRA, compactness should still be factored into drawing districts. However, this doesn't mean geometrically minimizing the circumference to surface area ratio. The term compact is itself subjective, with no fixed definition. However, it is common to describe a small sedan coupe car as compact even if it might have more surface area than something more box-shaped. Ultimately, compactness should entail keeping regions or metropolitan areas whole when logical and not combining far-flung parts of states with little in common. Let's examine the current congressional districts.
Embedded Content
The above interactive map details which party and entity drew the districts in each state and which party the lines were meant to favor. Click each state to find more info. States in solid red or blue were drawn by Republicans or Democrats respectively. Green represents maps drawn by a court. States in purple represent bipartisan compromise. Those in yellow were drawn by independent commissions. States in orange were drawn by bipartisan commissions in a fair manner. Light red states were drawn by bipartisan commissions who picked partisan Republican proposals. Lastly, the states in gray only have a single, at-large district.
It should be overwhelmingly obvious that Republicans had a massive advantage in drawing the lines. A full 239 seats, 55 percent of the entire House, were drawn to favor Republicans. Only 44, or 10 percent, were drawn specifically to favor Democrats. Centrists like to complain that both parties gerrymander, but the difference in terms of how much influence the parties had is stark.
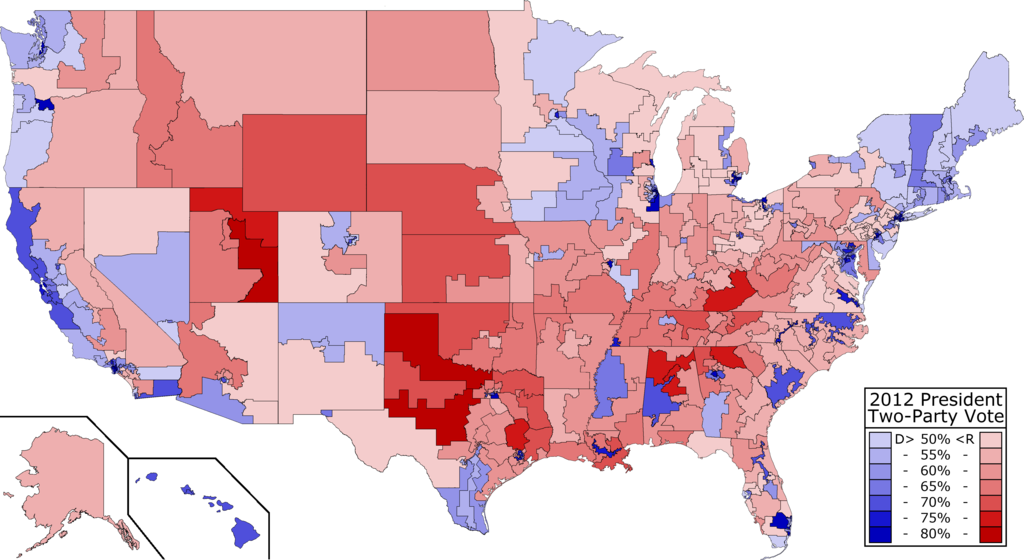 Click here for an interactive version of this map by electoral and demographic numbers
That advantage in drawing House districts resulted in a congressional map that looks like this when colored by 2012 presidential results. In particular, the lines in Republican-drawn states like North Carolina and Pennsylvania are grotesque. On the other hand, while Maryland is hideous, it's only because Democrats drew it for parochial rather than partisan reasons. Democrats there easily could have drawn a much cleaner map where every district is safe.

This histogram shows the distribution of seats by comparing Obama's share of the vote to the national result. It should come as no surprise that the massive disparity in who drew the lines resulted in a bias toward Republicans. There were 226 districts that voted for Romney while just 209 went for Obama. The median district, indicated by the black line, was Washington's third, which Romney carried by 1.6 percent. Thus the map's overall bias was 5.6 percent, given Obama's four-point win nationwide.
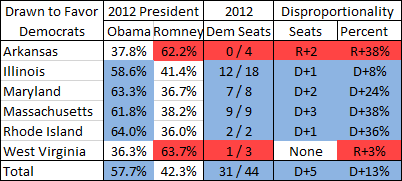
Let's examine more closely the impact of who drew the lines on the election results themselves. Comparing the percentage of seats won by Democrats with Obama's vote share, we can approximate the disproportionality of districts. Overall, if seats were distributed by presidential performance in each state, Democrats would have won 225 seats to Republicans' 210. Looking at the six states drawn to favor Democrats, they won five more seats than Obama's vote share would have awarded.
Note however that despite drawing the lines, Democrats were incompetent enough to obtain two fewer seats in Arkansas than they should have even proportionally. This is not unique to Arkansas, as Democrats in many states drew mediocre gerrymanders. In Illinois they could have won two more seats, while in Maryland they could have won an additional seat. In 2014 this number would have expanded to six thanks to West Virginia. Keep that in mind the next time someone tries to blame both parties equally.
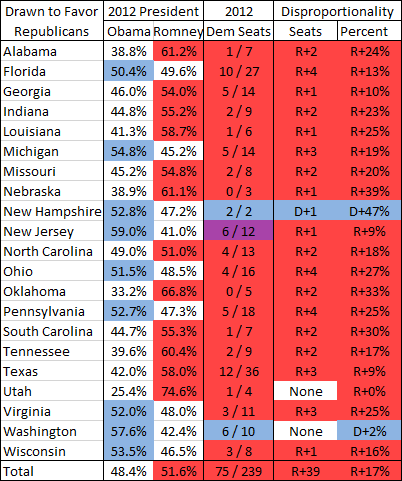
Republicans were far more strategic about the way they drew maps. In nearly every state they won more seats than Romney's vote share would have awarded, sometimes drastically so. In New Jersey and Washington the maps were implemented by a bipartisan commission, but they were still intended to favor Republicans. In total, they won 39 more seats than a proportional distribution would have awarded, leaving just a single obvious seat on the table in Tennessee.
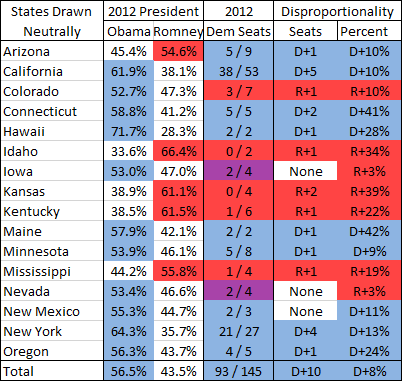
Looking at the states drawn without intent to favor either party, it should be clear that Democrats can win without gerrymandering. In total these states elected 10 more Democrats than would have been warranted by Obama's vote share. Not every one of these maps is flawless, but in states such as California, Democrats won five seats more than they should have. That more than counteracts states like Kansas where they won fewer than they ought to.
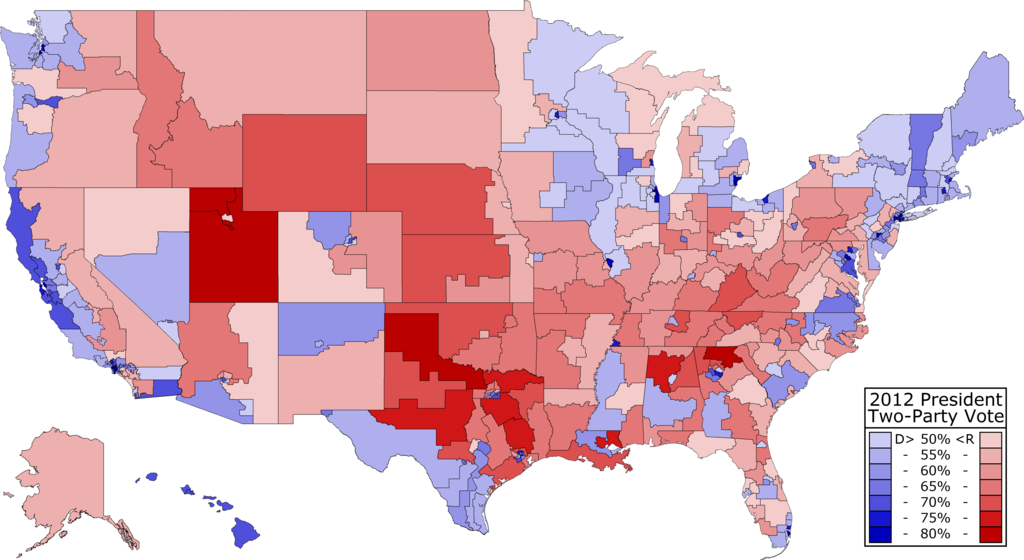 Click here for an interactive version of this map by electoral and demographic numbers
My proposed districts above look much cleaner and contain many more competitive seats that are closer to the national popular vote. The median seat is now California’s 36th, which Obama won by 3.2 percent, just 0.7 percent worse than his national performance. Thus, the map still skews Republican, but geography bias is not nearly as bad as partisan gerrymandering.
In the next several installments of this series, I will examine each individual state map in greater detail, arguing for why the new districts are drawn as they are and elaborating on the likely outcome. You can find the files and data for all these maps here, along with a statement on the methodology used to draw them.

Note that even with these alternate, nonpartisan districts, there are still many seats that are very strongly favorable to one party. Gerrymandering is responsible for some, but not most of the partisan polarization of Congress. Look no further than the Senate to see that the lines don't need to change for ideological polarization to increase. Instead these changes are mostly driven by demographics, media institutions, and the end of the Democratic Party being supported by conservative, white Southerners due to regionalism, among other factors.
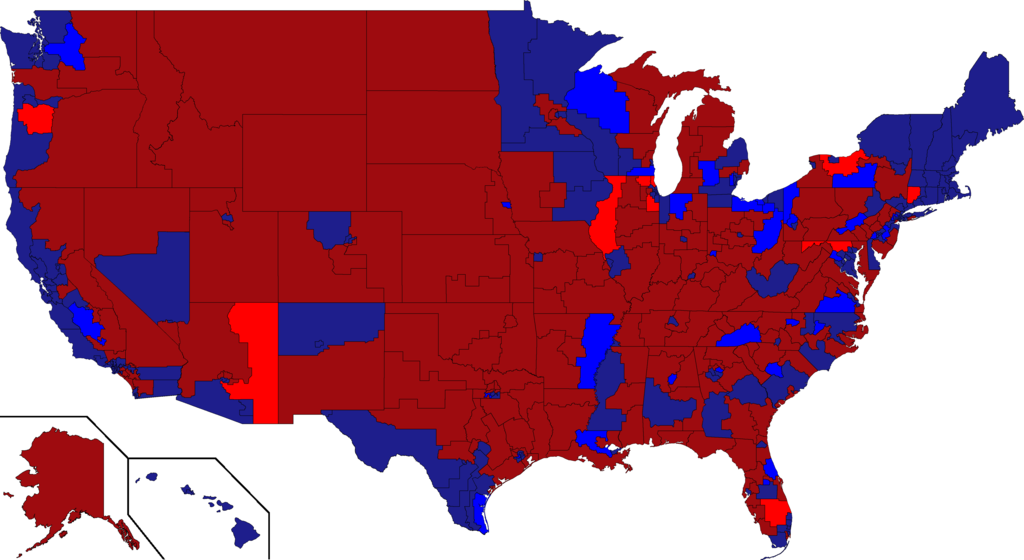
So what might the impact of these maps be? Above is the net change in party compared to the actual elections. Districts in dark blue or red see no change, while those in bright blue or red are a gain for Democrats or Republicans, respectively. The single biggest change is Ohio, where Democrats gain five seats, followed by four in Pennsylvania, and three each in North Carolina and Texas. For Republicans, it's four in Illinois, with no other states seeing more than a net of two seats change hands for either party.
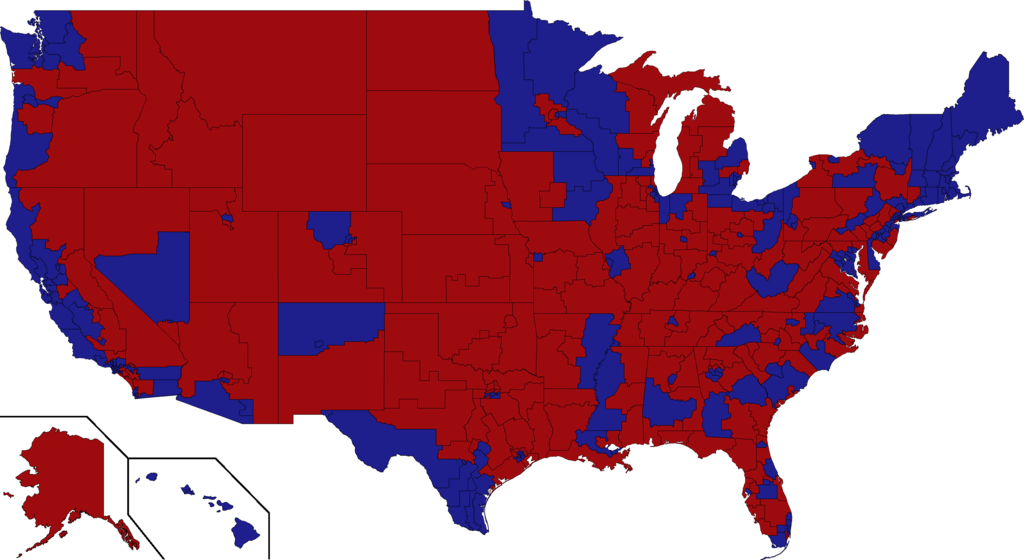
In total, Democrats would hold 14 Romney districts while Republicans win 27 Obama seats. That represents an increase of 15 districts splitting their tickets for president and House. Overall, Democrats win 25 more seats for a majority of 226 to 209. Even the more conservative estimate gives Democrats exactly the 17 additional seats they needed for a majority. Thus I find it highly likely that we can hold gerrymandering alone responsible for the Republican majority.
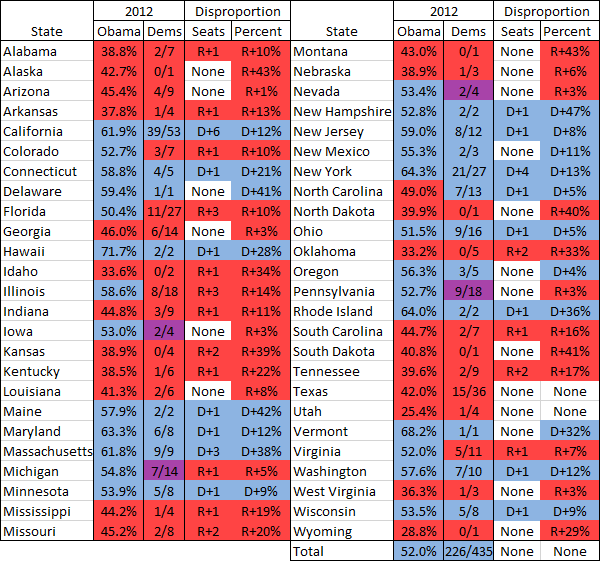
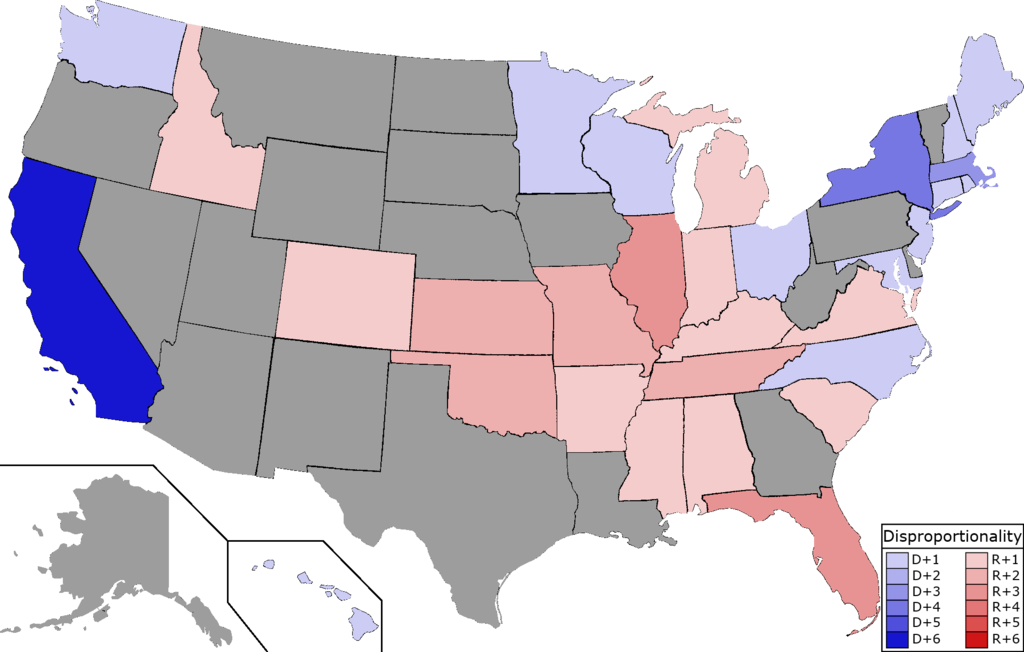
Measuring the disproportionality compared to Obama's vote share, there is actually perfect equivalence with Democrats winning 52 percent of the seats. Not every state is proportional, but states such as Missouri or Tennessee are counterbalanced by California and New York. A considerable factor in Democrats holding extra seats in certain states is incumbency, such as in North Carolina.
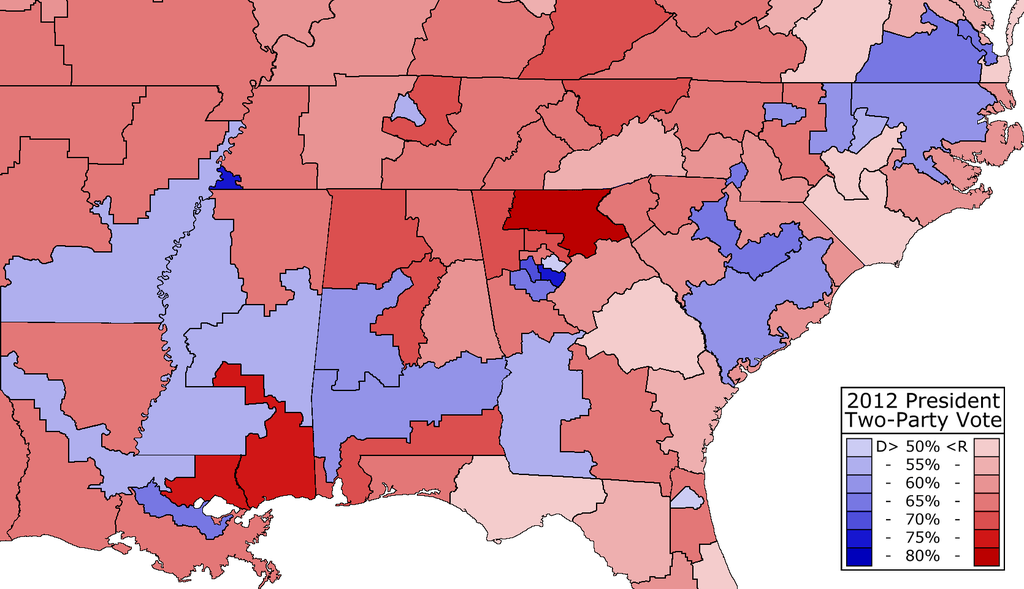 Click here for an interactive version of this map by electoral and demographic numbers.
One more alternate proposal concerns an interpretation of the VRA. In several Southern states, lawmakers could have drawn an additional heavily black district. I believe this should have been required especially in Alabama, but also Louisiana and South Carolina. Racial polarization is extremely high, providing a compelling interest in order to avoid discrimination for maps that are still somewhat compact, all things considered. None of these changes would have resulted in additional Democratic seats, but they do make the second Democratic district safe.
The above map also shows what it would take to draw another heavily black district in Arkansas and Mississippi. The Arkansas district is only 43 percent black, which is probably enough to reliably elect a black candidate, but should clearly not be required. The second Mississippi seat shouldn't be required under current VRA jurisprudence due to compactness.
However, single-member districts already significantly disadvantage minority voters, with the median seat being several points whiter than the country itself. Only 22 percent of districts were majority minority, let alone a majority of a single minority race. The law should be changed to require additional VRA districts in states such as Mississippi where racial polarization is overwhelmingly present. At the very least, a minority-influence district could be required even if short of a majority of a particular race, but the Bartlett case prevents this.
Minority under-representation is one area where added proportional representation is by far the superior alternative to single-member districts. Parties can preference minorities or women on the national list to make up for their lack of representation at the district level. In certain countries such as France, parties are even required to field an equal number of men and women for certain offices, something that our country desperately needs as well.
Ultimately, Republicans know their lock on the House rests on gerrymandering, having carefully plotted in the 2010 election which key legislative districts were needed to control the process. The party hit the jackpot to have their biggest wave election in decades determine who would control redistricting. If gerrymandering didn't matter, why would Republicans be so aggressive about ensuring they could do it in practically every state?
In the era of one person, one vote, gerrymandering has never been worse than it is today. Partisan polarization, partisan segregation, and computer technology have allowed cartographers to craft stronger, more precise maps than anything in the previous five decades. This problem will only be exacerbated by the continued increase in polarization and the geographic sorting of the electorate.
When a party can regularly win control of a legislative body despite coming in second, this is a system that is broken at best, or quite simply rigged. The problem is even more pervasive at the state level, where Republicans won chambers in several states despite popular vote losses in 2012. We must reform the manner in which redistricting is carried out, taking the pen out of lawmakers' hands as California did.
If the Supreme Court doesn't strike down Arizona's redistricting commission, Democrats would be fools not to back redistricting reform ballot initiatives in Arkansas, Florida, Michigan, Nebraska, Ohio, and Utah. Short of that, winning gubernatorial elections in the 2018 cycle when the important states are up is critical. If control over redistricting next decade resembles anything close to what it was this past one or even today, Republicans could easily gerrymander their way into another illegitimate majority.
Gerrymandering is a cancer to our democracy and it must end.


