2020 New York redistricting, with 26 seats and using 2020 projected populatioN for towns and incorporated places. Detailes below the town, village or borough level are not available. The 2020 projected population was arrived at by using the 2014 estimated populations of the Census bureau, projecting the changes to 2020
New york City projected populations are for boroughs, and are too general to be useful in preparing maps for the affected congressional districts, so I prepared maps generally based on the prior district, all reduced to on common population factor.
CDs crossing the NYC city limits are accurate [projected ] for the portion outside the city, but are subject to my allocation to them of NYC population.
Long Island: I used the projecte populations, but in a number of cases town boundaries had to be crossed, where I used my estimate in distributing the increased population between CDs.
All CD in upstate New York were conformed to town, city, and village boundaries, with the very minor exception in one or two cases, involving splitting off a precinct.
This map reflects the projected loss of one seat for New York.
One caution on the numbering for CDs: In an attempt to retain CD #s in conformance with the 2012 unbering system, I used DRA with 27 districts, while assigning CD19 0 population.
A general view of the shift of CDs within the state.
Two factors were the major ones in the change of districts from 2012 to 2022:
1. The loss of a seat to the state, causing an average loss per seat of 3.85%
2. A major differential population change between the 4 bouroughs[less Staten Island] and the rest of the state. Note I have separated out Staten Island since its population change is more similar to the balance of the state than to the other 4.
27 seats 26 seats 26 seats
2010 2010 2020 & change
26 seats
upstate 9.9056 9.5387 9.0676 95.06%
western 5.0785 4.8904 4.6546 95.18%
northenr 1.0205 .9827 .9281 95.44%
capitol 1.1676 1.1243 1.1074 98.50%
mid hudson 1.5917 1.5327 1.4513 94.69%
mid state 1.0474 1.0086 .9263 93.63%
rockland/
westchester 1.7567 1.6916 1.7293 102.23%
nyc[4borough] 10.7375 10.3398 10.8678 105.11%
Richmond .6531 .6289 .6149 97.77%
Long Island 3.9471 3.8010 3.7204 97.88%
Upstate: the 4 county capitol region almost maintained its seats. The loss seems to be spread around the other delimited areas. The loss of a seat to the state is mostly born by this region.
NYC actually increased[marginally] its number of seats by about 1/2.
Rockland and Westchester marginally [very marginally] increase its portion of seats.
Long Island lost about a quarter of a seat from 27 [2010] to 26 [2020]. This is reflected in CD04 gaining more of NYC
General comment re upstate.
Because of the increased size of an individual district population wise, almost all of the obvious Dem districts would gain Rep. precincts unless said gains are carefully monitored.
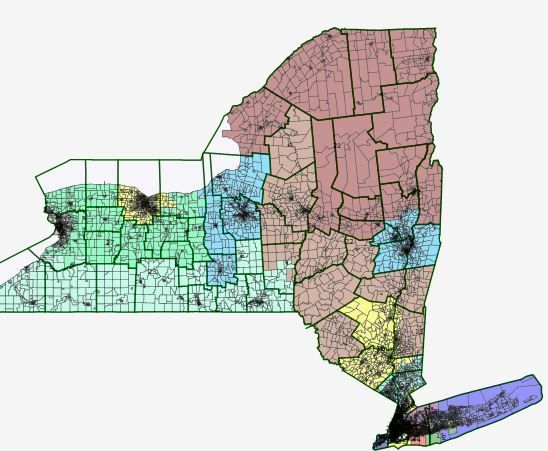
2012 map
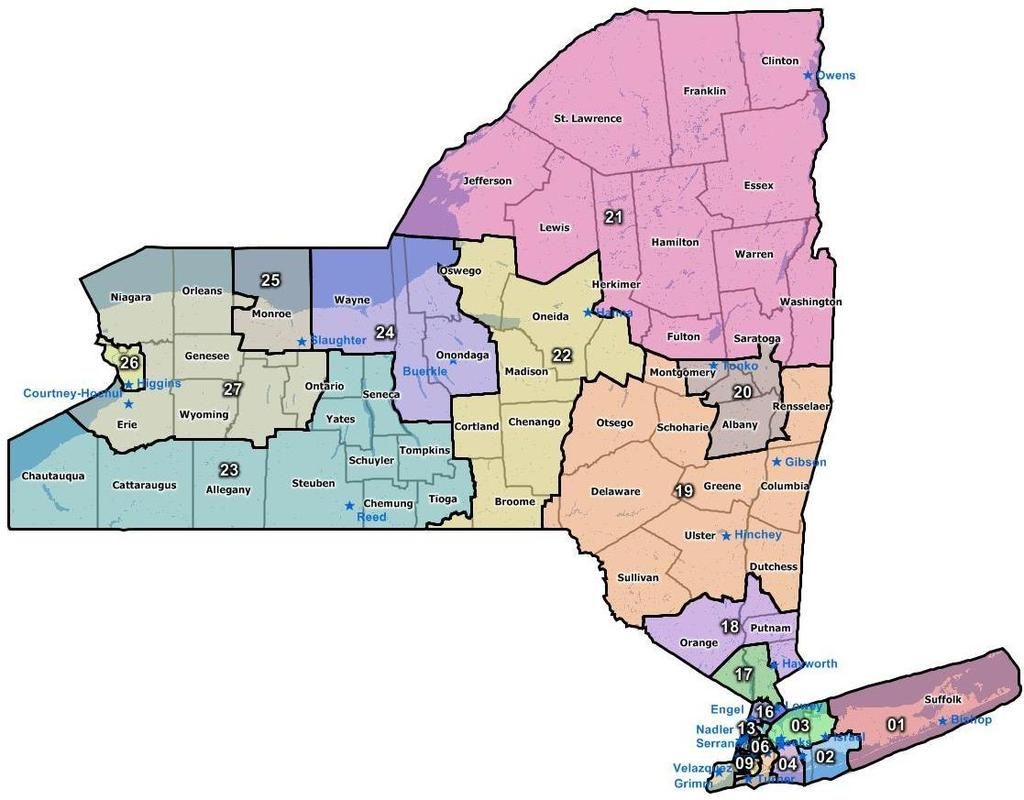
2022 state map
http://i781.photobucket.com/...
INDIVIDUAL DISTRICTS
Western New York
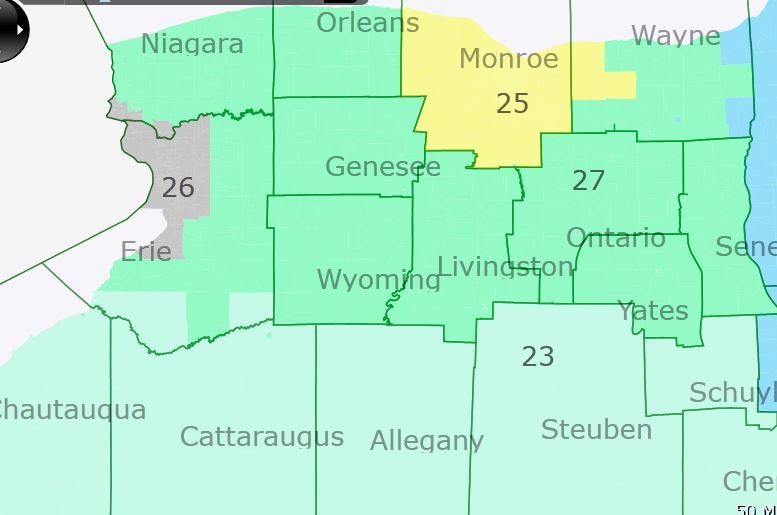
CD27
This solid Rep district loses population to both CD26 and CD25. Expands to the west to the border of Cayuga County, seizing most of Wayne county from CD24.
new
44.6%Obama 2008
43.1% Dem
old
2012 obama 42.9% 2008 Obama 44%
cd26
This solid Dem district gains the balance of Hamburg, threatening no one.
new
62.3% obama 2008
old
2012 Obama 63.9& 2008 Oobama 63%
cd25
This Dem district gains the balance of Monroe and some of Wayne county. A Dem gerrymander and a Non partisan redistricting would each probably result in the same increase of Republicans. There just is no close Dem areass to incorporate
At some point the present population trends which necessitate the expansion of the district into nearby Republican areas will be serious, especially considering the 2014 congressional election result here.
new
2008 57.7% Obama
old
2012 obama 58.8% 2008 obama 59%
cd24
for this district I made deliberate decision to absorb Tompkins Couny into CD 24. As a Democratic stronghold it is doing no good in CD23, while it can significantly shore up CD24.
Recent congressional history demonstrates that this district needed shoring up.
new lines
2008 obama 59.4%
cd23
Republican district
lost Tompkins, gains some midstate areas
Broome County here is heavily Democratid, but there is no obvious place for it. Possibly an Onondaga/Tompkins/Broome county could be constructed, but at nearly 60% Obama for CD25, I see no compelling need.
new
2008 obama 46.9% obama
old lines
2012 obama 48.4%, 2008 obama 50%
Northern New York
http://i781.photobucket.com/...
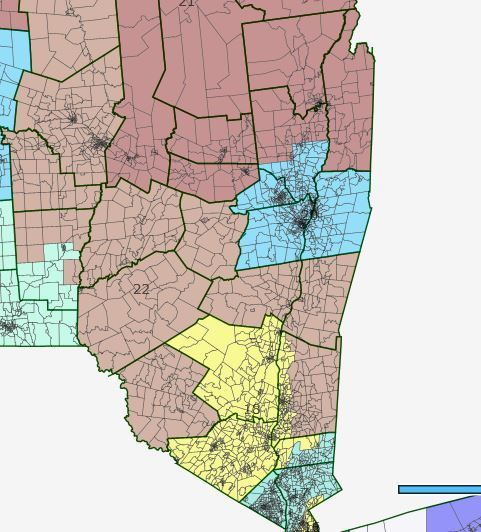
cd 22
Republican territory
Probably equally from the old 22 and the old 19
Does this look like a lobster?
I included Lewis County here primarily because the countly lines made a happy conclusion with no overlap; I otherwise probaly would have put part of Herkimer here.
old lines
Obama 2008 48.3%
new lines
2012 obama 2008 48.8% obama 49%
cd21
Northern NY.
The expansion of size of each district population meant that this district acquires new R voters. I feel that an attempt to increase its competitiveness coould only threaten Democratic CD20, which also had to increase its georgraphic base. Even so, Obama still got 51.1% in 2008
new lines
obama 51.1% 2008
old lines
obama 2012 52.2% obama 2008 52%
cd20
Solid Democratic. Expanded to acquire balance of rensellaer county
new
2008 obama 59.2%
ole lin3w
obama 2012 59.2% obama 2008 58%
cd19
Disappeared. Have reported the loss to The New York State Department of Corrections, which has recent experiance in finding lost items.
Tossup district occupied by a Democrat, at least for now.
old lines
52.1% 2012 obama 53% 2008 obama
cd18
This could just as well be called CD19, since much of it comes from the old 19.
A key district for a democratic gerrymander. A non partisan district would most likely have all of Dutchess County, and lose half of Ulster county, making it a lean Republican
It loses all it had in Westchester and the Republcian part of Putnam County, and is composed of Orance, Ultster, and the western fringe of Dutchess.
I would expect that if the present incumbent of the existing CD!9, a democrat, would find this a significant impromement
The present incumbent, a Republican, might well paint a target on the Republican occupant of CD22, who now would represent a lot of what was her district.
new lines
obama 2008 55.7%
old lines
2012 obama 51.4% 2008 obama 52%
cd17
Gains what CD18 had in Westchester county, and takes on the Republican areas of Putnam County.
new lines
obama 200859.2%
old lines
obama 2012 57.1% 2008 obama 58%
cd16
6% less democratic.
new lines 67.1% obama.
obama 2012 73.5% obama 2008 73%
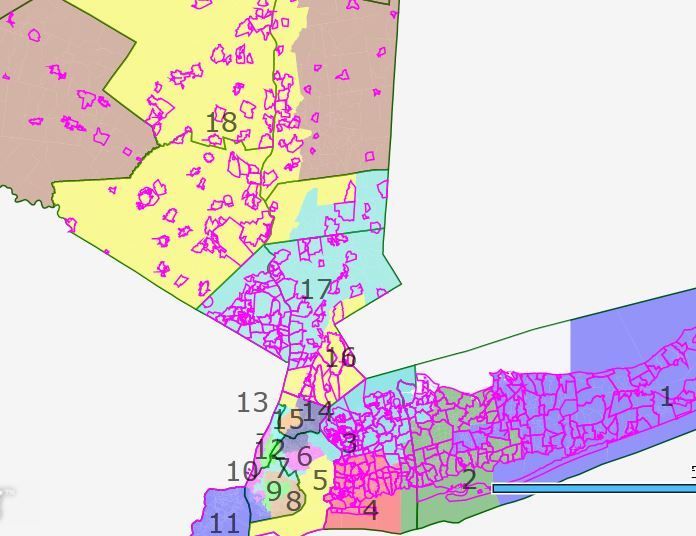
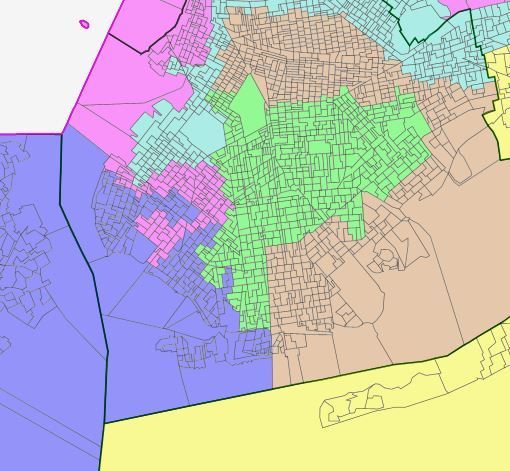
CD05-cd15, exclusive of CD11
heavily democratic. The new estimates I have do not have sufficient detail to prepare a de novo map, so I just used dra to prepare districts roughly the same shape as now.
http://i781.photobucket.com/...
CD11 Staten Island
State Island's populaltion gain did not conform to that of the other 4 boroughs. I estimated how much of Brooklyns gain would go to CD11, then used dra to draw in as many D precincts as possible without going too wild.
might be lean d in a good year
new lines
2008 obama 50.1%
2008 dem 53.4%
old lines
2012 obama 51.6% 2008 obama 48%
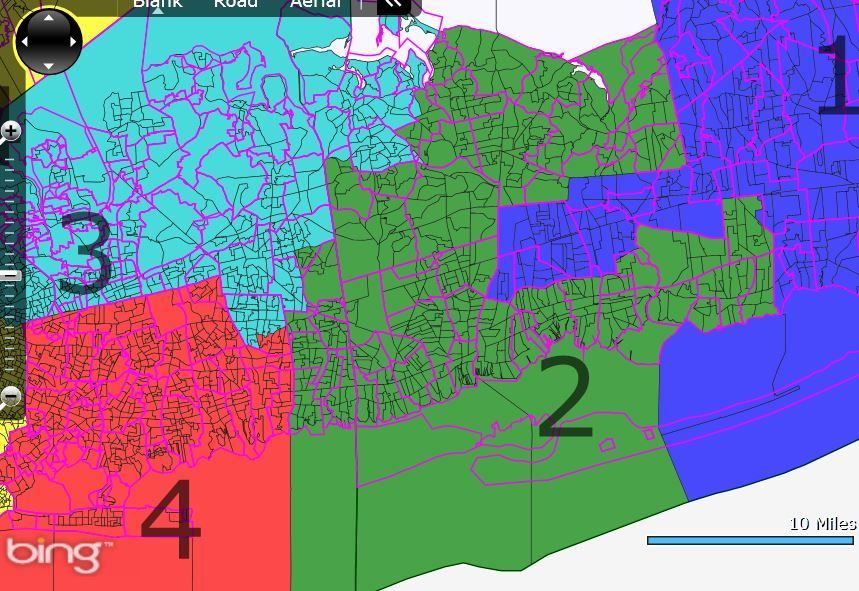
cd04
Hempstead township sans Levittown,
new lines
56.2% obama 2008
old lines
2012 obama 56.3% 2008 obama 55%
cd03
new lines
55.2% obama 2008
old lines
50.8% obama 2012 54% obama 2008
While preparing this district I realized that a Democratic gerrymander needs to include Democratic areas in the north western corner of Suffolk county and exclude Republican areas in southern Oyster Bay town. The reverse would result in almost 50% obama in 2008
CD02
The new district is a result of excluding Democratic areas going to CD03 and CD01.
new lines 48.5% obama 2008
old lines
51.6% 2012 obama 51% 2008 obama
CD01
Stay out of Smithtown.
grab those D precincts in the center of the island.
lean democratic
new lines
obama 54.9% 2008
old lines
2012 obama 49.6% 2008 obama 51%

