One of the first political books I ever read was the Almanac of American Politics 2006 which I read as an 11 year old. It discussed how Democratic nominee Sen. John Kerry increased Democratic turnout in Democratic parts of Ohio compared to Vice President Gore in 2000. Kerry increased turnout in Cuyahoga County (Cleveland), Franklin County (Columbus) and overperformed in Hamilton County (Cincinnati). According to the Almanac, if President Bush’s margins in the Republican rural areas had remained the same compared to 2000, the passage said, Kerry would have won Ohio by 17,000 votes and thus the Presidency. Kerry lost Ohio by 119,000 votes because Bush had increased Republican margins in heavily Republican areas.
A similar phenomenon happened in Florida 2016: Secretary Clinton increased her margins in almost every Democratic county, especially in the Gold Coast region. Those margins could have given her a strong win compared to President Obama’s 2012 win and her win would have been in line with polls showing her with a 2%-3% win. Donald Trump, however, won Florida by about one point because he increased turnout in heavily Republican areas.
This article will analyze how Trump was able to win Florida and how Democrats can win Florida for the 2018 midterms and the 2020 Presidential Election. This article will break down Florida into a few regions: the Gold Coast (the Miami, Fort Lauderdale and Palm Beach area), the I-4 Corridor (the counties along Interstate 4), the rest of Florida and a sub-region: North Central Florida.
A data table with much of the county data can be found here:
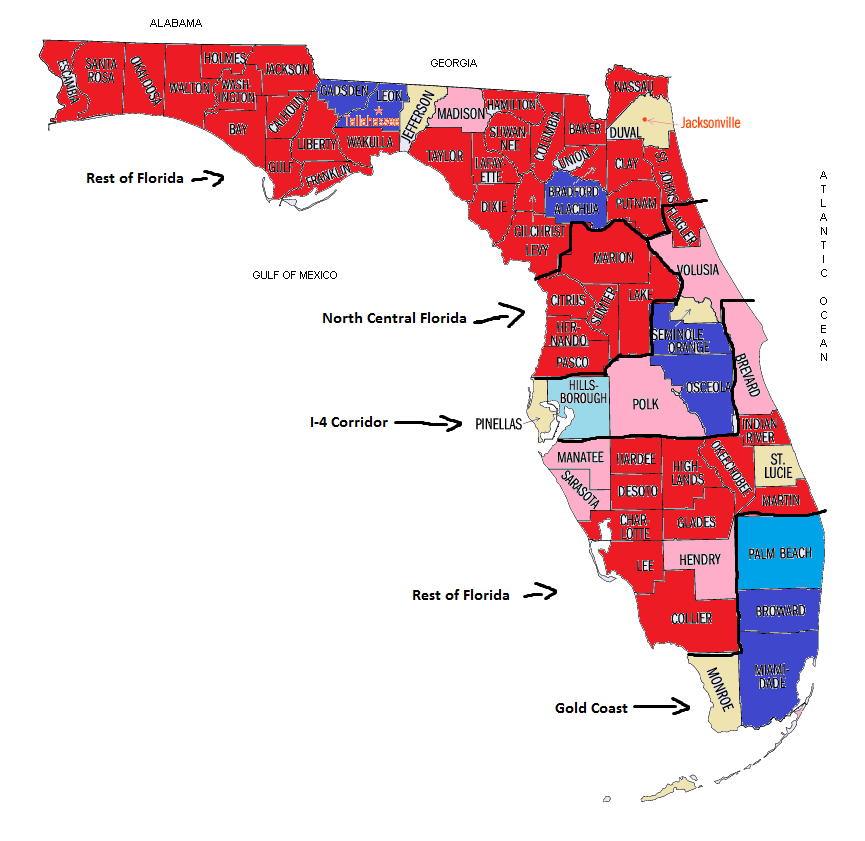
Map of Florida’s 2016 results:
Dark Red: Trump 20%+
Red: Trump 10%-19%
Tan: Trump 0%-9%
Light Blue: Clinton 0%-9%
Blue: Clinton 10%-19%
Dark Blue: Clinton 20%+
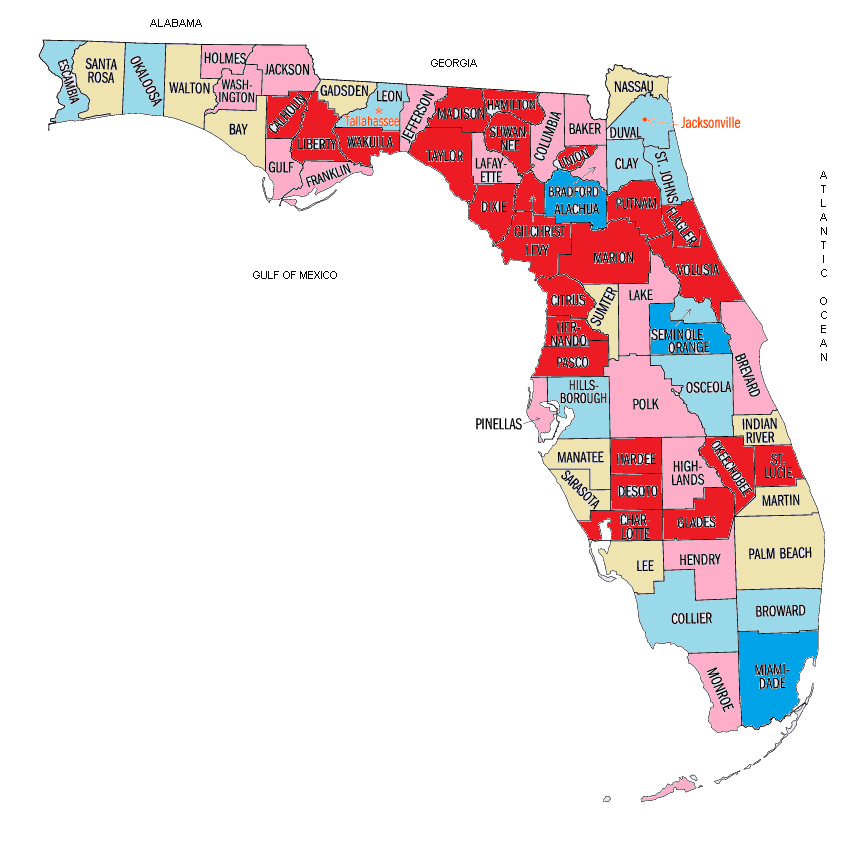
Map of Florida’s trends 2016 vs. 2012
Dark Red: 10+ point gain for Trump
Red: 5%-9% gain for Trump
Tan: 0%-4% gain for Trump
Light Blue: 0%-4% gain for Clinton
Blue: 5%-9% gain for Clinton
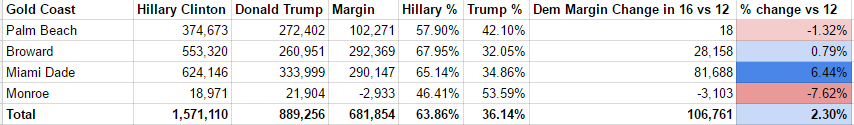
The Gold Coast:
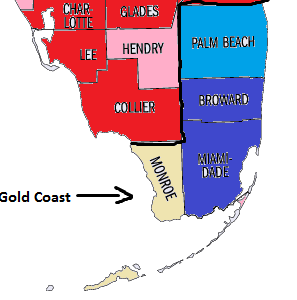
The Gold Coast (Palm Beach, Broward, Monroe and Miami Dade Counties) is Florida’s most densely populated region and where Democrats earn the bulk of their margins. While demographics may not have been enough to win Florida, they are enough to produce historic margins in the Gold Coast. One theme as to why Clinton lost Florida is that she performed poorly among Cuban voters. While she may not have won Cuban voters, she outperformed Obama in Miami Dade County which is home to Florida’s highest population of Cuban voters.
While Clinton’s margin in Palm Beach County remained static, she increased her margin over Obama’s by 28,000 votes in Broward County which has a rapidly shrinking white population (it is at 39% compared to 57% in 2000). Broward County is also the 2nd most populous county in Florida. Where Clinton overperformed Obama the most is in Miami Dade County, home to nearly one out of seven Floridians. She won a margin of 290,000 votes there and 63% of the vote, 82,000 higher than Obama’s in 2012. This represents a long term shift toward the Democrats in Miami Dade County. As recently as 2000, Gore won Miami Dade County by only 39,000 votes and by only seven points. Miami Dade also has a 67% Latinx population with a high Cuban population and although Cubans are historically primarily Republican, many Cubans, especially younger ones have started voting Democratic.
Gold Coast Data Table: (all election data is from the U.S. Election Atlas and New York Times)
For full data tables click here:
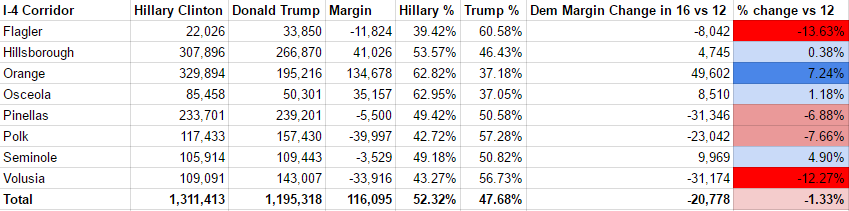
I-4 Corridor:
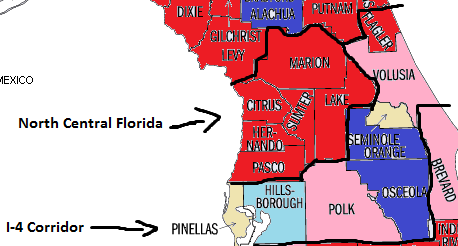
The I-4 Corridor is defined by the author as the counties of Pinellas, Hillsborough, Polk, Osceola, Orange, Seminole, Volusia and Flagler. This fast growing area with the Tampa metropolitan area (Hillsborough and Pinellas Counties), the Orlando metropolitan area (Orange, Osceola and Seminole Counties) and the Daytona Beach area (Volusia and Flagler Counties) is historically a swing area in Florida. It is home to Hillsborough County (Tampa) which from 1964 to 2012 voted for the presidential winner of Florida. This year, however, Clinton won Hillsborough County even though she did not win Florida.
One narrative suggests that Clinton lost the election because she was unable to turnout Latinx voters. While Latinx turnout may vary from state to state, she did not lose Florida due to Latinx turnout. In fact, Clinton nearly flipped historically Republican Seminole County, losing by only two points and Democrats gained Seminole County’s congressional seat which was held for 20+ years by a Republican, due to the Latinx growth in Seminole County (it was at 20% in 2015, compared to 17% in 2010). Also, Clinton won Orange and Osceola Counties by 29 and 25 points respectively (Orange contains Orlando with a large Puerto Rican population and Osceola is suburban with a rapidly growing Puerto Rican population and a 51% Latinx population). Thus, with a combined 171,000 vote margin from the two counties, Clinton increased her margin over President Obama’s by 57,000 votes.
If margins in the counties outside of the Gold Coast and Orange/Osceola Counties did not change compared to the 2012 election, Clinton would have won by 237,000 votes in Florida, matching President Obama’s 2008 margin and matching many of the pre-election polls.
As we have seen, that did not happen and the I-4 Corridor reflects this. Trump gained votes in heavily white Pinellas, Volusia, and Flagler Counties. Each of the three counties has an above-average elderly population, and each is over 70% White. Volusia County for example went for Romney by one point in 2012 but in 2016 went for Trump by 13 points (the author also has relatives who live there). Even though Clinton nearly flipped Seminole County, Trump was able to flip Pinellas County in the Tampa Area with a 75% White population. Trump was able to reduce the Democratic margin in the I-4 Corridor and to help offset Clinton’s gains in the Orlando area.
I-4 Corridor Data Table:
For full data tables click here:
Rest of the State:
The rest of Florida contains retirement areas along the West Coast, the Panhandle, some East Coast of Florida communities and the Jacksonville area. Some analysts say that a low turnout among African Americans hurt Clinton, but the results show that did not occur at least in urban areas. Clinton overperformed Obama in Duval County (Jacksonville) where she lost by 6,000 votes compared to Obama’s 16,000 vote loss in 2012 (Duval County has a 30% African American population). Clinton also overperformed Obama in Alachua County (University of Florida) which has a 21% African American population as well as a high number of millennials. She also matched Obama’s numbers in Southwest Florida which is more wealthy. In contrast, Trump won large margins throughout the rest of the West Coast, the Florida East Coast north of Palm Beach County and the heavily Republican Panhandle.
Many analysts blame Trump’s win on the heavily conservative Panhandle that reported late and erased Clinton’s narrow statewide lead. The Panhandle voted heavily for Trump and he received roughly an 186,000 vote margin from the five counties on the northwest part of the Panhandle (Escambia, Santa Rosa, Okaloosa, Walton and Bay Counties) which is higher than his 113,000 statewide win. The Panhandle, however, is not responsible for turning Florida red compared to 2012 because the Panhandle was already heavily Republican and voted heavily for Romney in 2012 as well (he received roughly a 168,000 vote margin). These counties border Alabama, are culturally very southern, have voted extremely Republican for decades so there are less swing voters to persuade and less new Republicans to turn out compared to other Florida regions. Trump’s margins in the Panhandle were expected, yet they were not responsible for flipping Florida. One of the major regions responsible for Trump’s win in Florida is what I describe as “North Central Florida.”
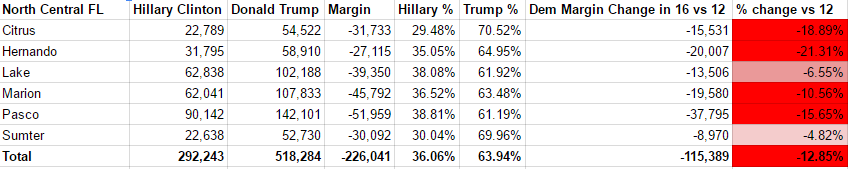
North Central Florida
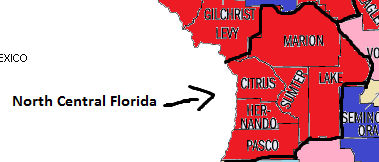
My previous Florida analyses have not singled out this area, instead dividing Florida into the “Gold Coast”, “I-4 Corridor” and “Rest of the State” but six counties I describe as the “North Central Florida” area are key due to the unmistakable Trump trend and demographic similarities. The counties are Citrus, Hernando, Lake, Pasco, Sumter and Marion. They are mostly part of Florida’s old 5th Congressional District from the 2000s and all of the counties have high retiree populations as evidenced by the high 65+ population ranging from 22% in Pasco County to 54% in Sumter County (which is partially home to the Villages, a large and fast growing retirement community).
These six counties are all located directly north of the I-4 Corridor and in the 2000s were extremely fast growing, slowed during the recession but have started seeing new growth post recession. They are all >70% White and have a large population of Midwesterners. In 2000, Gore won two of these counties, in 2008 Obama was close in Pasco County. It may be noted that Lake County is closely connected to the I-4 Corridor due to its proximity to Orlando, but it is included with the other five counties north of Tampa due to demographic similarities with a high population of retirees and a low minority population (Lake County also contains part of the Villages).
In 2016, however, these counties gave Trump a 226,000 vote margin with 64% of the two party vote and a roughly 115,000 margin gain over Romney’s margin in the area (111,000 votes with 58% of the two party vote). That 115,000 increase in 2016 compared to 2012 is higher than Trump’s statewide 113,000 vote margin. If the Republican margins in these six counties stayed stable compared to 2012, Clinton would have won Florida, although by roughly 2,000 votes, a situation similar to the 2000 election.
Gore won two of these six counties and even Obama in 2012 came close in Pasco and Hernando Counties. As recently as 2014, Charlie Crist (D) who ran for Governor (and lost by one point) lost Pasco County by one point and lost Hernando County by three points.The 2014 Gubernatorial race was a bit of a reverse of the 2016 Presidential race where Crist lost narrowly in >70% White counties such as Pasco, Hernando and Volusia Counties but lost because he could not run up the score in heavily Latinx areas such as Osceola and Miami Dade counties. Overall, both Obama and former Governor Crist show that, although difficult, Democrats can narrow the margins in these six counties.
North Central Florida Data Table:
For full data tables click here:
Conclusion:
Overall, how was Trump able to win Florida?
He was able to produce stunning margins from unexpected areas. Clinton was able to overperform Obama on the Gold Coast, heavily Latinx areas such as Osceola and Orange Counties and even in areas with high African American populations such as Broward and Duval (Jacksonville) Counties. If Trump received the same margins Romney received in all the counties outside of the Gold Coast plus Orange and Osceola, Clinton would have won Florida by 237,000 votes matching President Obama’s 2008 margin. Trump’s win relied on increased turnout in Florida’s West Coast and North Central area above Romney’s numbers, mainly in areas that were >70% White with a high population of former Midwesterners. Republicans such as Romney in the previous election made improvements with white voters, but those were mainly white rural voters north of Ocala which are culturally southern. Trump made those same improvements in areas with high populations of former Midwesterners. Also, unlike the northern rural counties which are mainly slow growing, North Central Florida is fast growing (although the growth slowed after the foreclosure crisis and many of the voters there in 2016 may not have lived there in 2012.
As shown by the high turnout numbers in the Gold Coast and the Orlando area, the reservoir of new Democratic voters may be drying. Therefore, in order to win in 2018 and 2020, Democrats need to ensure that their margins in the counties just north of the I-4 Corridor such as Pasco, Hernando, Sumter and Lake return to President Obama’s 2012 levels.

