Minnesota is one of the rare states whose congressional and legislative districts were drawn in a nonpartisan way. Republicans controlled the legislature while Democrats held the governorship after the 2010 census, and the two sides were unable to reach a compromise on new maps. As a result, a court had to step in and draw the lines, and it did so without regard for the kind of partisan considerations that lawmakers would have put front and center. Consequently, an impressive five of the state’s eight congressional districts saw competitive races in 2016, a much higher proportion than we typically see elsewhere.
However, nonpartisan redistricting isn’t a perfect answer to gerrymandering, and as we’ll explain below, Minnesota illustrates how even a nonpartisan approach can give one party a majority of seats even if it receives fewer votes than the other party statewide.
Make no mistake, gerrymandering is a serious problem. After Republicans drew roughly 55 percent of congressional districts and Democrats just 10 percent in the most recent round of redistricting, Mitt Romney won a majority of congressional districts, even though President Obama won by nearly 4 percent nationally in 2012. Daily Kos Elections previously proposed nonpartisan congressional maps similar to Minnesota’s for every other state, and our analysis strongly suggests that gerrymandering cost Democrats control of the U.S. House in 2012. However, gerrymandering isn’t the entire root of the problem because geography matters, too.
That’s because Democrats are typically more geographically concentrated than Republicans. Cities like Minneapolis vote overwhelmingly Democratic, while rural areas and suburbs have a substantial yet more more modest Republican lean. Nonpartisan redistricting traditionally favors geographically compact districts, which means that such an approach can result in a handful of dark blue districts while a majority of seats favor Republicans by more modest margins.
And while gerrymandering is the graver problem, geography really does significantly hurt Democrats in certain states like Minnesota. Even though Donald Trump lost by 1.5 percent statewide, he still managed to carry five of the state's eight congressional districts—a majority—even with a non-gerrymandered map.
So let’s take a look at just how problematic it can be to have such a mismatch between which party wins the most votes and which wins the most districts.
The chart below compares the presidential election margin with the congressional result in all 94 congressional districts nationally that had both major parties on the ballot and where Daily Kos Elections has calculated the 2016 presidential result so far:
There was a relatively strong correlation between the two results, and thus far only eight districts split their tickets, meaning they voted for one party for president and the other party for Congress. That’s just 9 percent of the total, and when split-ticket outcomes are this rare, it matters immensely how the presidential candidates perform in each district.
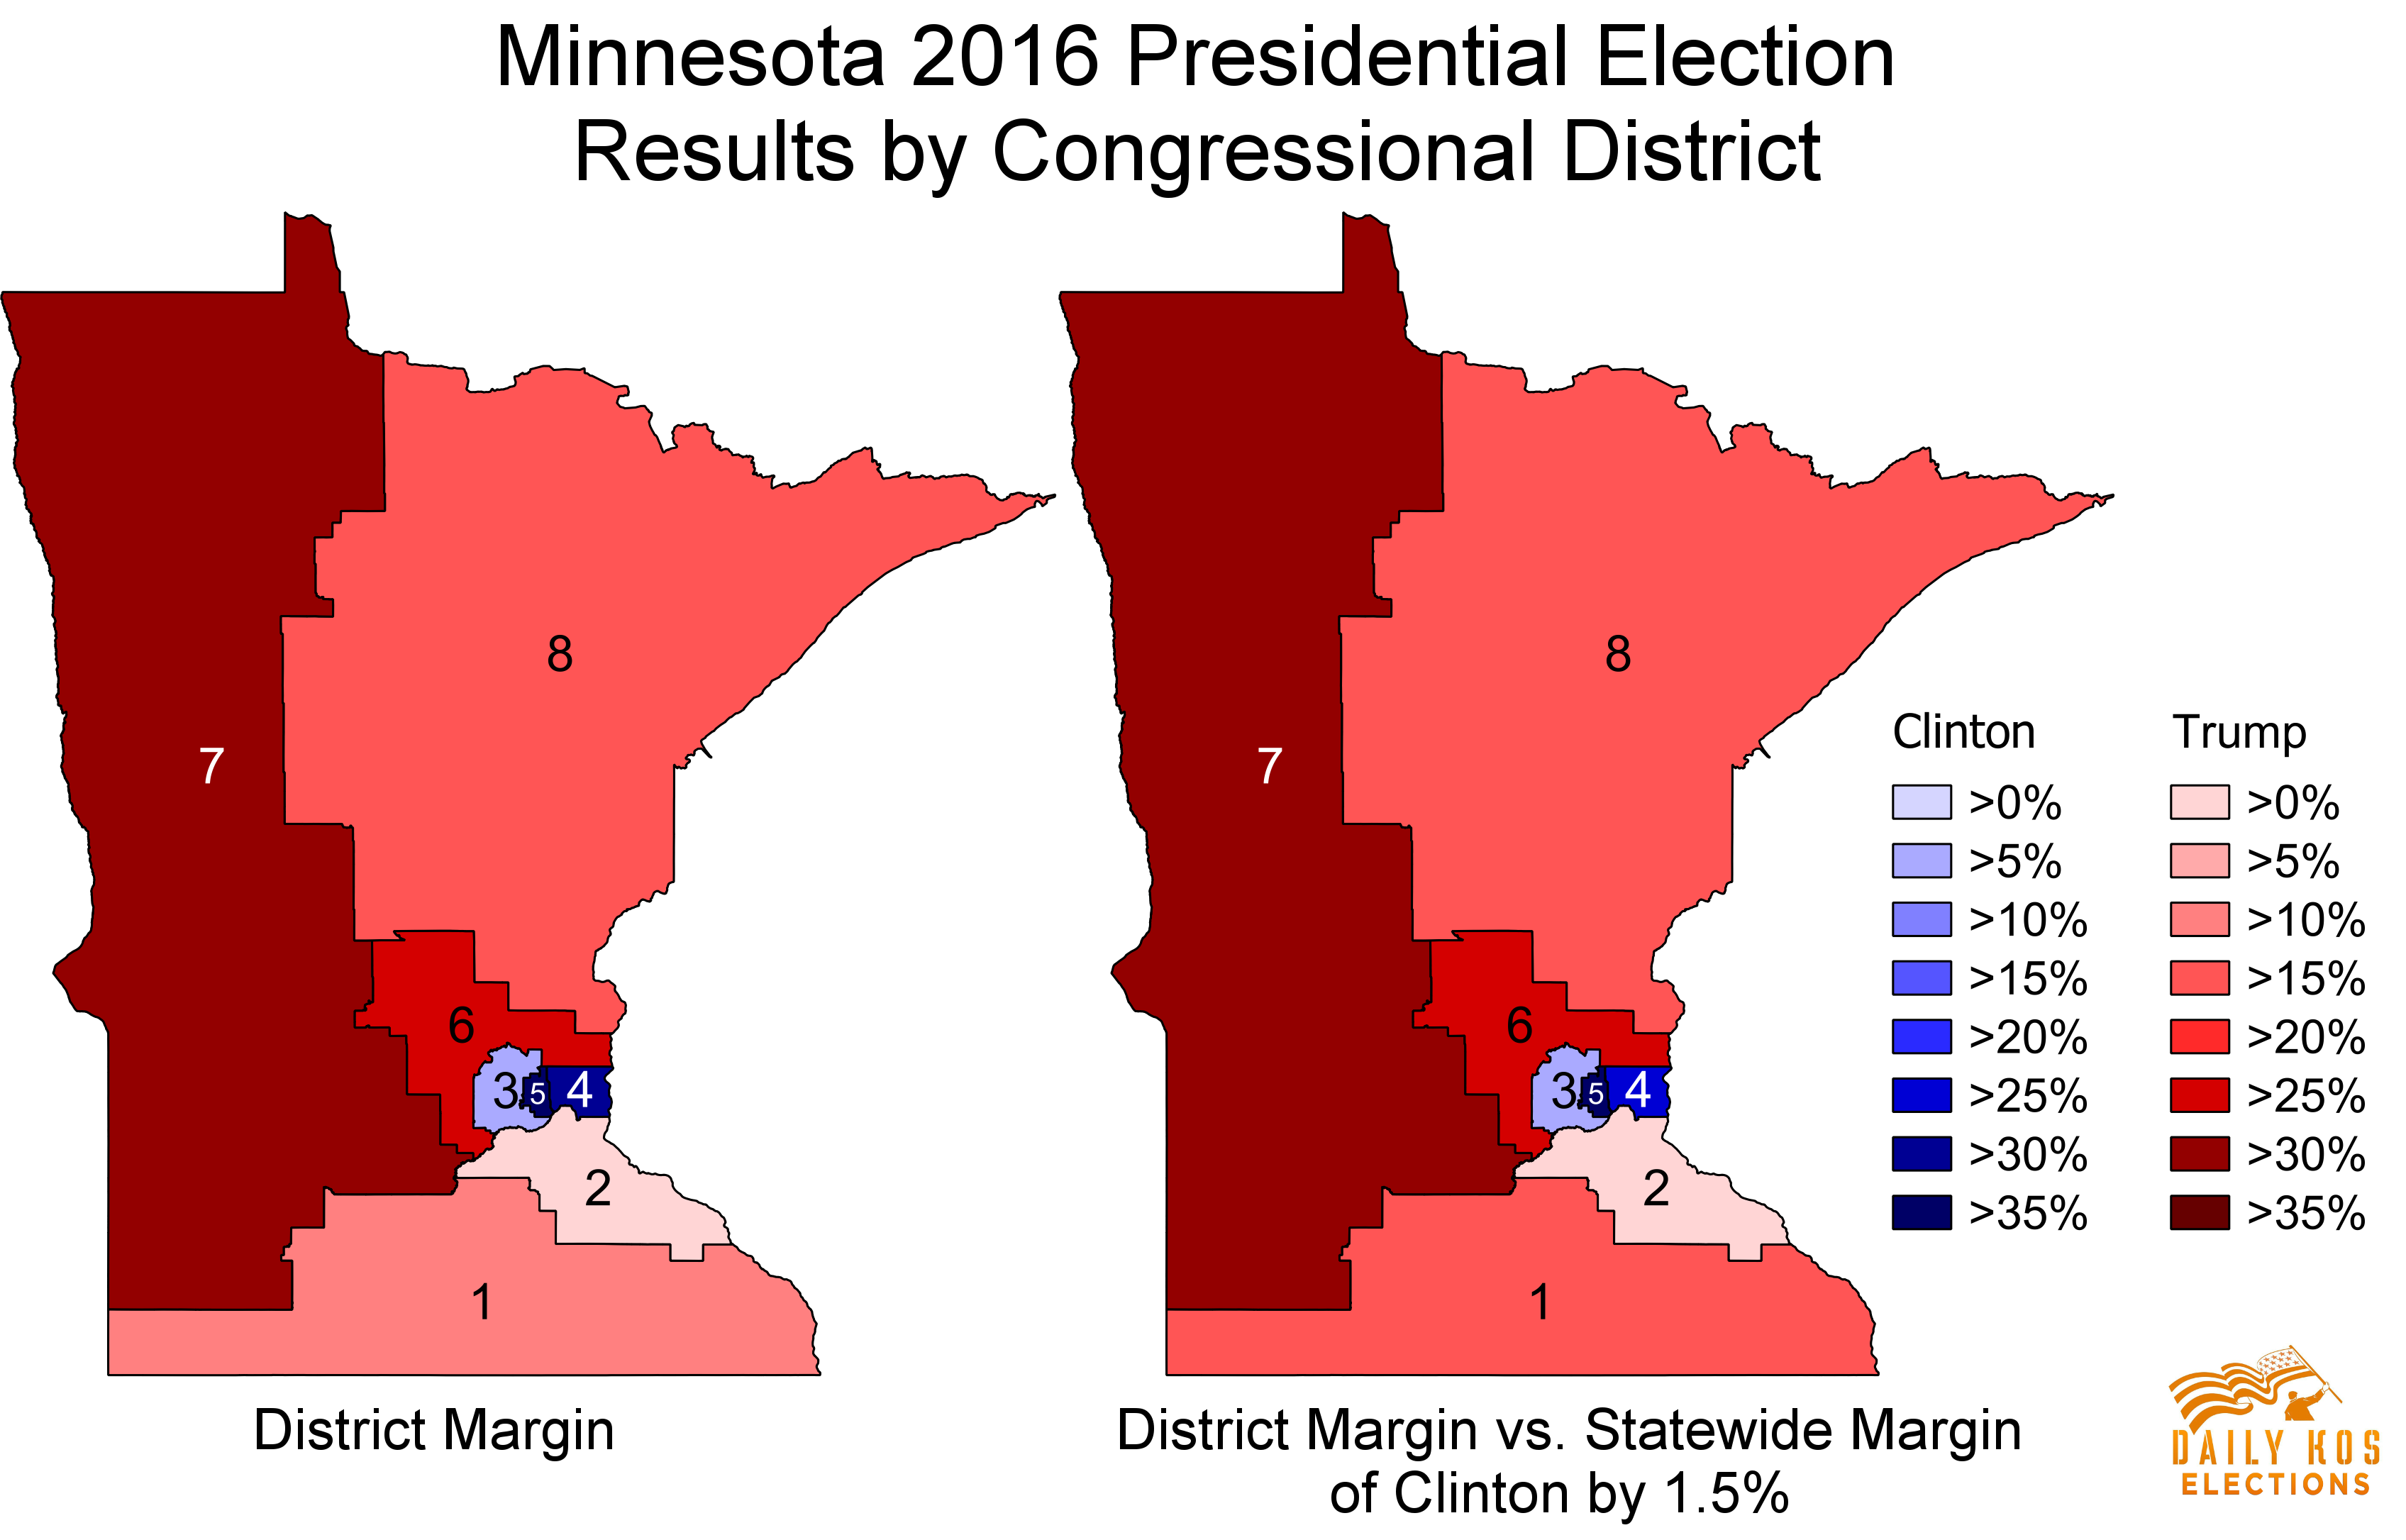
Looking again at Minnesota’s 2016 presidential results by district, this version shows the presidential election margin on the left, while the map on the right compares each district result to the statewide outcome. If Clinton won a district by greater than her statewide margin of 1.5 percent, that district is more Democratic than the state and appears blue, while if she won by less than her overall margin or lost a district, it’s more Republican and appears red. Since Clinton’s statewide margin was so small, the two maps are nearly identical. Clinton won three districts by more than her statewide margin of victory, while the other five that she lost were of course worse for her than her overall narrow statewide win.
Comparing the margins in each district with the statewide result is crucial for letting us calculate the “median district,” which lets us determine whether a map has an overall bias toward one party. What that means is that if we ranked every district from most Democratic to least Democratic (as measured by Clinton’s performance), the median district would be the one where exactly half the seats were more Democratic and half were less.
Once we’ve figured out the median seat, we want to look at the margin there—that is, how much Clinton won it by or lost it by. The median seat margin is important because it gives us an idea of how wide of a statewide margin one candidate might need to win a majority of seats. Ideally, the median margin would be very close to the statewide margin. But if the median differs substantially from the statewide result, that means the overall map tilts toward one party or the other, and in a close statewide election it could allow one party to win most districts despite receiving fewer votes overall. That’s exactly what happened this year with Trump.
Since Minnesota has an even number of districts, we can average the presidential election margins of the two in the middle to find the median. In the chart below, Minnesota’s 1st and 2nd Congressional Districts were the two middle-most:
| District |
Incumbent |
Party |
Clinton |
Trump |
Margin |
| MN-05 |
Ellison, Keith |
(D) |
73.7 |
18.5 |
55.2 |
| MN-04 |
McCollum, Betty |
(D) |
61.5 |
30.6 |
30.9 |
| MN-03 |
Paulsen, Erik |
(R) |
50.8 |
41.4 |
9.4 |
| MN-02 |
Lewis, Jason |
(R) |
45.3 |
46.5 |
-1.2 |
| MN-01 |
Walz, Tim |
(D) |
38.4 |
53.3 |
-14.9 |
| MN-08 |
Nolan, Rick |
(D) |
38.6 |
54.2 |
-15.6 |
| MN-06 |
Emmer, Tom |
(R) |
33.2 |
58.9 |
-25.7 |
| MN-07 |
Peterson, Collin |
(D) |
31.0 |
61.8 |
-30.8 |
Clinton lost the 2nd by 1.2 percent and the 1st by 14.9 percent, for a median 8.1 percent loss. Because Clinton won statewide by 1.5 points, we know that this median seat is 9.6 points worse for Clinton’s margin than her overall statewide result. That’s a sizable Republican bias. If every district were to swing her way by the same amount, Clinton would have needed to win statewide by 2.7 percent to carry exactly half of the state's eight districts, but by a staggering 16.4 points to win a 5-3 majority like Trump did in reality.
The 2012 presidential election results for these same districts seen above show the median district disparity in even sharper contrast. Barack Obama won Minnesota by 7.7 percent, and that was a big enough statewide margin that he carried a hefty six of eight congressional districts, as seen on the left. However, four of Obama’s district-level margins of victory were smaller than his statewide spread, meaning that a similarly large six of eight seats were more Republican than the state itself, as shown on the right.
Ranking the districts from most to least Democratic, the median two seats four years ago were the 1st and 3rd districts, where Obama won by just 1.4 points and 0.8 percent respectively. That’s a median of 1.1 percent, which was 6.6 points more Republican than the statewide result. Although the median seat was more skewed to the right for Clinton than it was for Obama, she at least could count three of eight districts supporting her by more than her statewide margin, thanks to her major improvement in the highly educated suburban 3rd District.
That means that Clinton’s coalition could give future Democrats a higher floor of support than Obama’s, but also a harder path to winning a proportional number of seats, let alone a commanding majority like Obama did. A 4-4 split would have been proportional to Clinton’s popular vote margin in 2016, and she only needed to improve by a modest 1.2 percent in the 2nd District to achieve that goal. However, if Minnesota had an odd number of districts, which could happen if it loses a seat in the next round of re-apportionment following the 2020 census, it might be very difficult indeed for future Democrats to win a 4-3 majority even if they prevail at the statewide level.
So how can Democratic candidates overcome the map’s underlying bias? One way would be to win by a sufficiently large margin statewide that they carry enough districts. That’s what Obama did in 2012, but 2016 wasn’t quite as Democratic-leaning of a year. Democratic congressional candidates won 3.5 percent more of the vote statewide than Republicans did in 2016, which was only 2 points wider than Clinton’s margin, yet Team Blue nonetheless won a 5-3 majority in the congressional delegation because of ticket-splitting.
 Click to enlarge
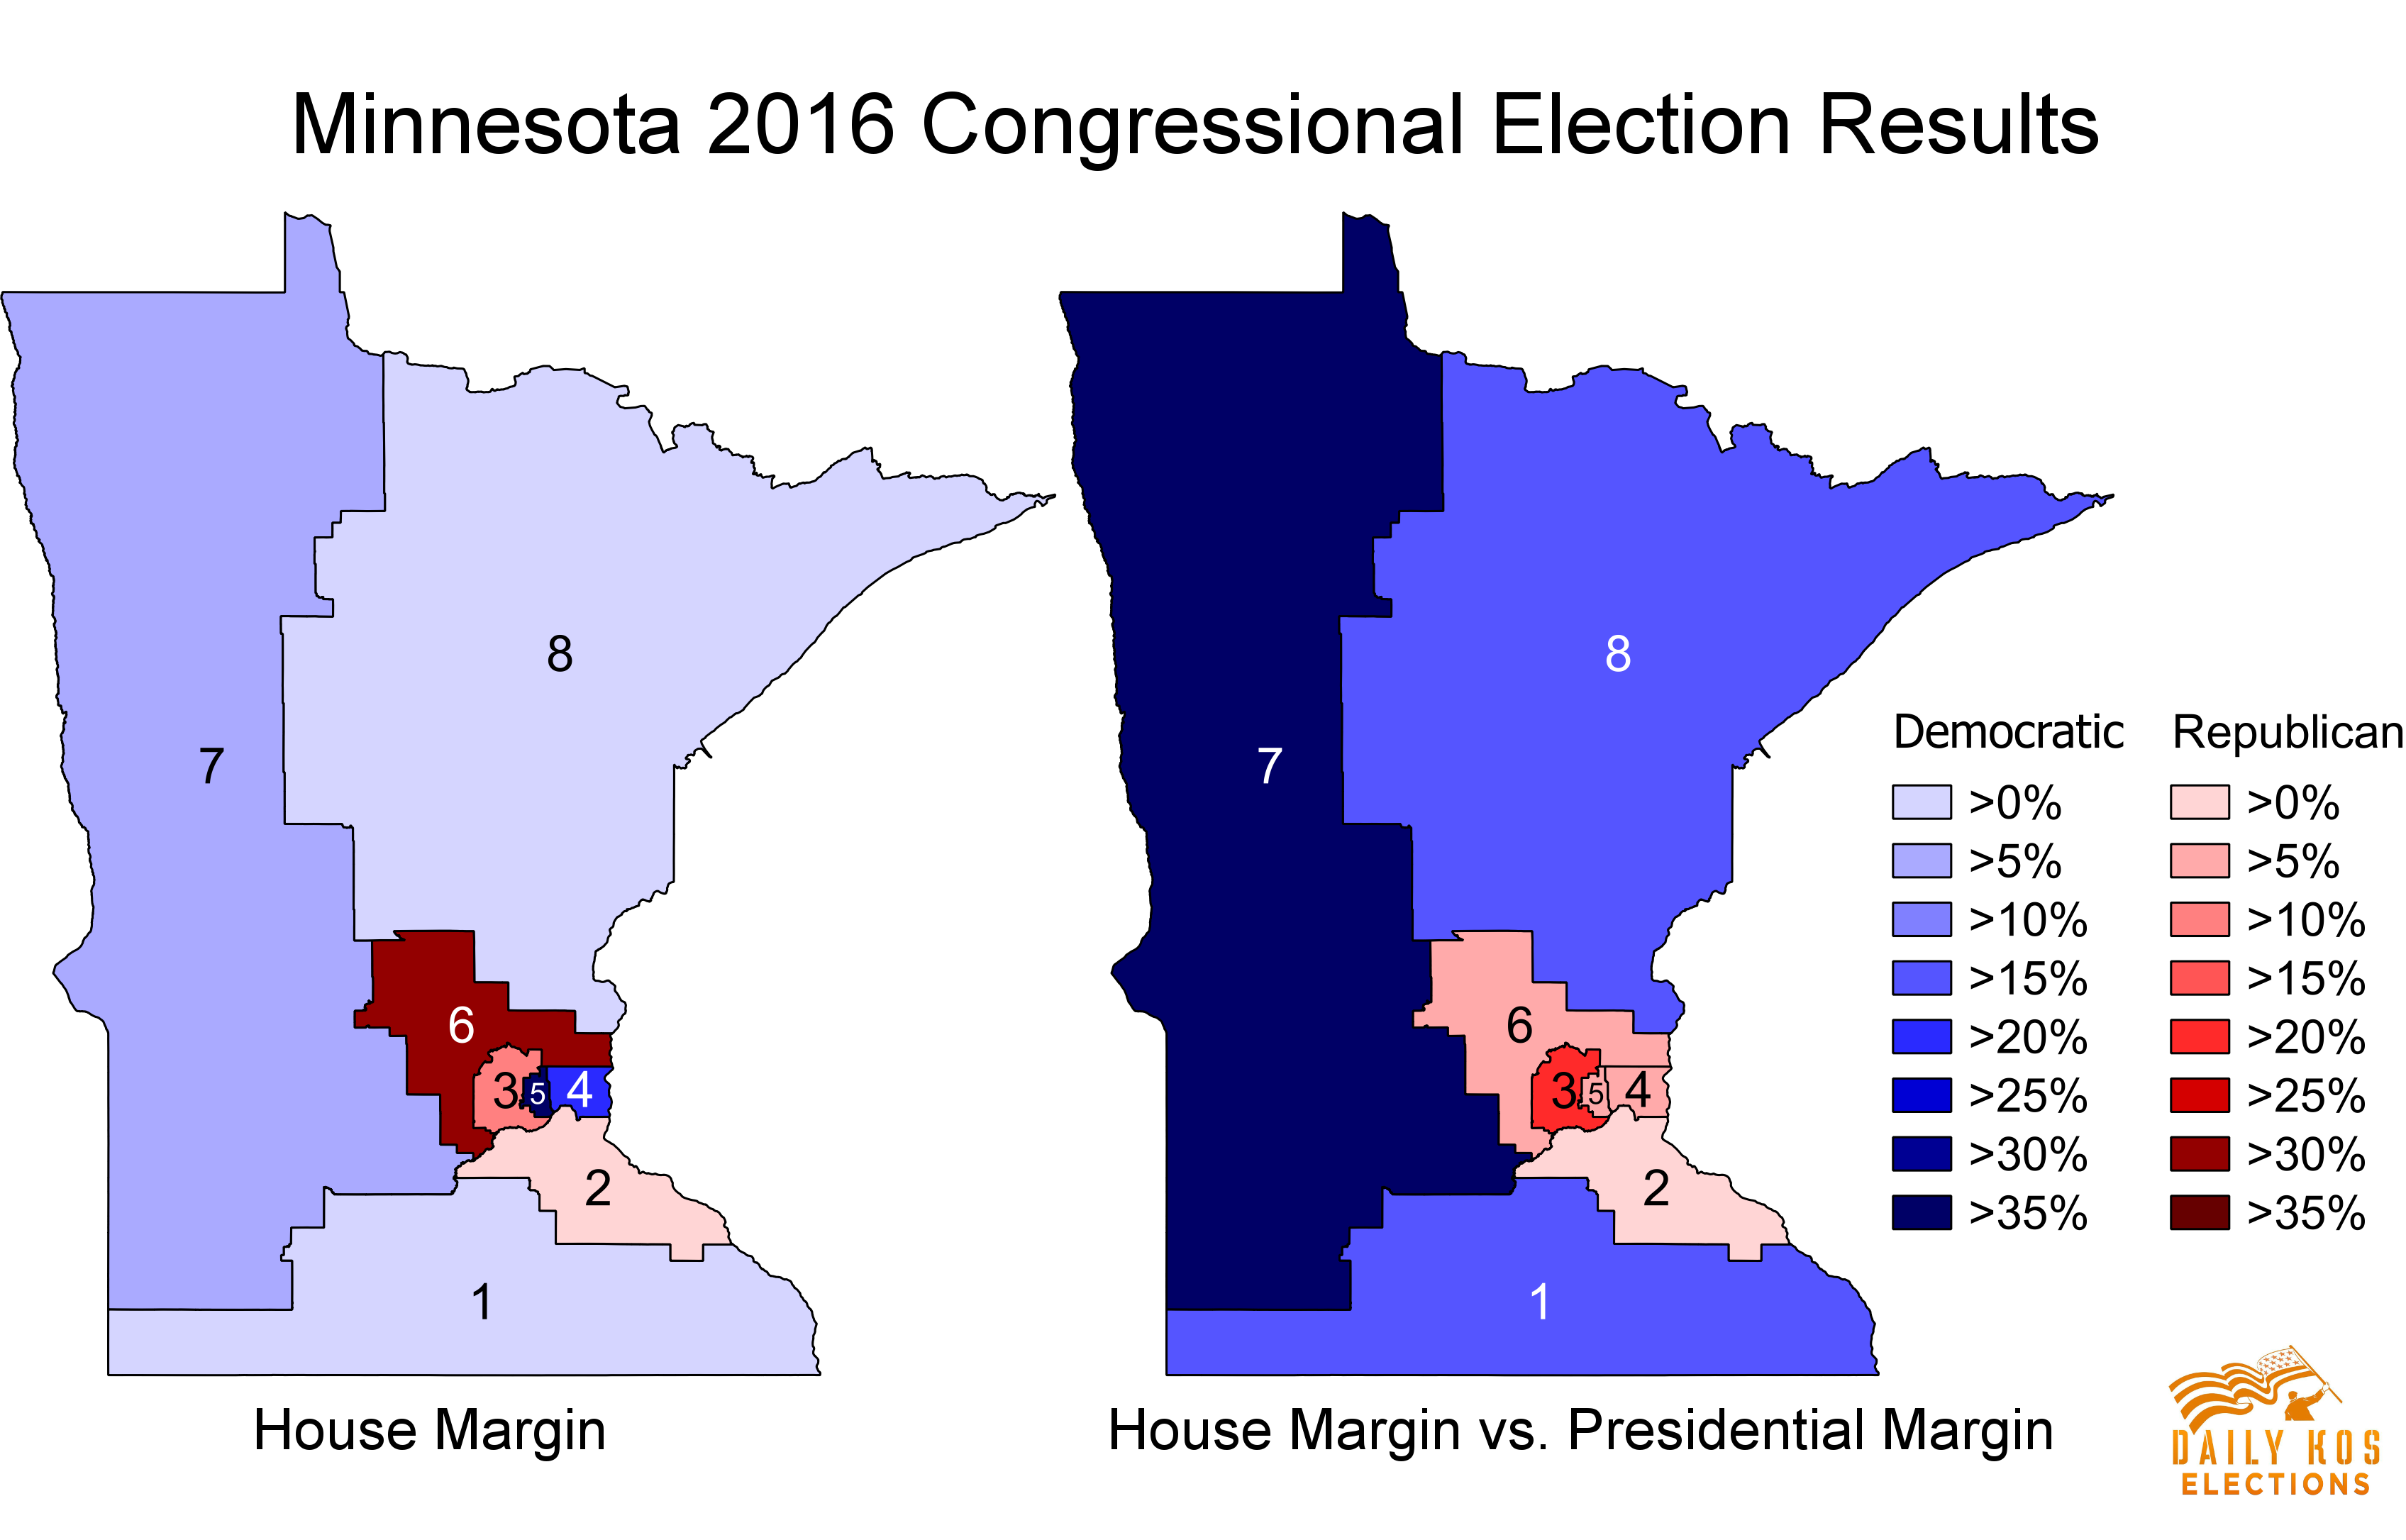
The above map on the left shows the House margin in each district, where Democrats just barely won by less than 1 percent in the 1st and 8th districts, while Republicans only retained the 2nd District by 1.8 percent. The map at right compares the congressional and presidential margins. Democratic incumbents in the outstate 1st, 7th, and 8th districts ran far ahead of Clinton’s double-digit losses there, enough to narrowly prevail. On the other hand, Democrats ran behind Clinton’s margin in all five Minneapolis-St. Paul metro area districts, particularly in the suburban 3rd, which Clinton and Republican Rep. Erik Paulsen both comfortably won.
When we graph the relationship seen earlier between the presidential and congressional margin in just Minnesota (as shown below), there’s a much weaker relationship between the two than there was nationally:
Indeed, Minnesota is home to half of the nation’s eight districts that split their tickets (of the 94 we’ve calculated so far), thanks in part to entrenched incumbents like longtime Democratic Rep. Collin Peterson, who won by 5 points even as Trump scored a 30.8 percent landslide in the 7th District.
If Democrats could continue to rely on ticket-splitting, they could also continue to overcome presidential geography bias to win majorities when they win the popular vote statewide. However, that isn’t something the party can count on when incumbents won’t be around to run indefinitely. It’s particularly noteworthy that the mere 0.8 percent gap between the presidential and congressional margins in the open 2nd District was a much smaller disparity than in any of the seven other districts, all of which featured incumbents seeking re-election. It’s quite possible that future elections could see Republicans congressional candidates winning a majority of House seats despite winning fewer votes statewide.
All of this isn’t to say that gerrymandering isn’t a major problem, because it is. Achieving nonpartisan redistricting by forcing more court-drawn maps or creating independent redistricting commissions would be a monumental step in the right direction. Nonetheless, there would still be cases like Minnesota where quirks of geography produce unintentional bias that favors one party over the other. So what can we do to fix it?
One relatively easier reform would be to create independent redistricting commissions like California has done, but require them to explicitly take partisanship into account. This wouldn’t be done to create an unfair bias toward one party like a regular partisan gerrymander, but to counteract the underlying geography bias that already unfairly disfavors that same party. A commission could attempt to draw a map where the median seat shares the same partisanship as the state overall so that the party that wins the most votes statewide also wins the most seats.
“One person, one vote” is among the most fundamental principles of our democracy. Our electoral system should reflect that value by ensuring that the party that wins the most overall votes also wins the most seats. Ending gerrymandering would be an enormously beneficial step toward a fairer electoral system. However, states like Minnesota demonstrate how it often simply isn’t enough, and we we need more fundamental reforms to guarantee fairness.