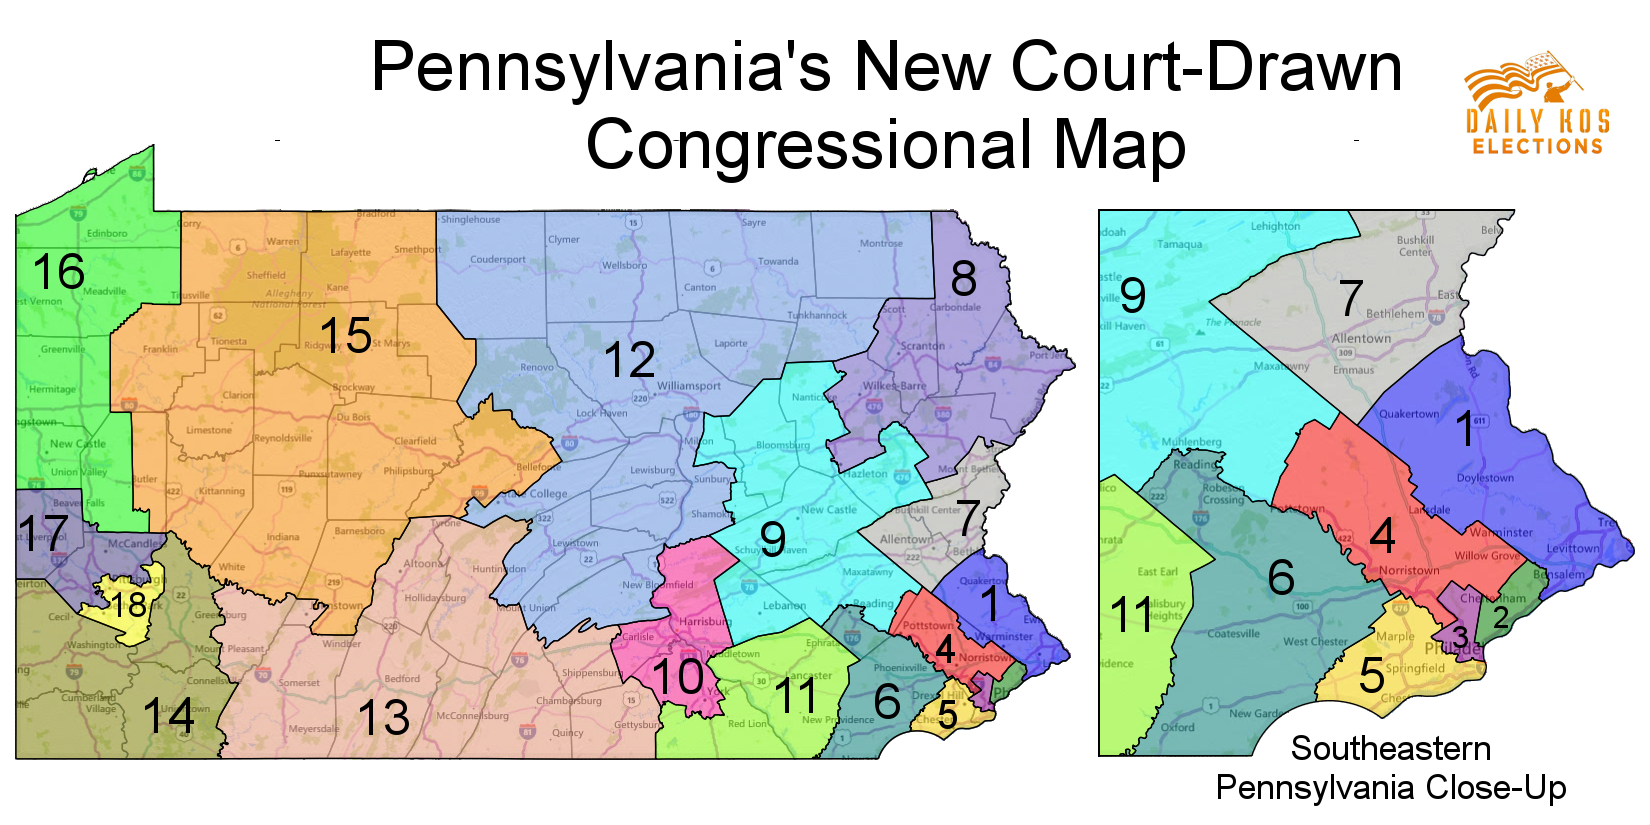
On Monday, Pennsylvania’s Supreme Court released new congressional districts created by Stanford Prof. Nathaniel Persily to replace the state’s old, Republican-drawn boundaries, which were struck down as an illegal partisan gerrymander in violation of the state constitution’s guarantee of “free and equal” elections. These new lines will not only allow for much fairer elections, but they’ll also improve Democrats’ chances of taking back the House this November.
In ordering a new map, the court laid down particular nonpartisan criteria it wanted the legislature to follow: Any new districts should be both compact and limit the number of cities and counties split between districts. Republican legislative leaders refused to pass a new map, though, so the court turned to Persily for guidance.
Persily’s map, which is shown at the top of this post (click here for a larger version), complies with both of the court’s criteria. But most interestingly, the court appears to have deliberately adopted a map that should give both parties a shot at winning an equitable number of seats, as befits Pennsylvania’s swing-state status. In other words, this map isn’t just nonpartisan, it’s fair.
According to calculations from political scientist Brian Amos, these redrawn lines contain 10 districts won by Donald Trump in 2016 versus eight carried by Hillary Clinton. Given that Trump carried Pennsylvania by just a 48.2 to 47.5 margin, that’s a much more equitable distribution than the invalidated map’s 12-to-six split. This new map could consequently give Democrats a much better chance of winning six districts that Republicans currently hold, something we previously predicted.
To drill down further, the court has published maps and files describing the new plan here, and we’ve created an interactive map of the districts, along with a more traditional map below that shows which counties belong in each district. Note that the court renumbered much of the map, so the old 1st District, for instance, doesn’t necessarily correspond with the new 1st District. To help keep these new seats straight, we've put together a table showing what portions of Pennsylvania's 2012-2016 congressional districts make up each new seat. Click here for an explainer on how to interpret this spreadsheet.
Because this new map did not take into account where Pennsylvania’s current members of Congress live or what sort of districts they might have preferred, we can’t say for certain yet where each incumbent currently seeking re-election might choose to run. However, we can make educated guesses, based in part on the population redistribution data described just above, which you can find in this table.
Based off these surmises, Democratic chances would likely improve against Republicans in PA-01 (Mike Fitzpatrick, old PA-08), PA-05 (OPEN/Pat Meehan, old PA-07), PA-06 (Ryan Costello, old PA-06), PA-07 (OPEN/Charlie Dent, old PA-15), PA-10 (Scott Perry, old PA-04), PA-17 (Keith Rothfus, old PA-12). However, PA-11 (Lloyd Smucker, old PA-16) has gone from light red to implacably Republican.
Overall, the court’s map is an enormous victory for democracy over one of the most extreme partisan gerrymanders ever created in the modern era. Consequently, it gives Democratic candidates a much fairer chance to win a majority of seats when they win a majority of votes statewide. Notably, that did not happen in 2012, when the GOP’s now-invalidated gerrymander produced a 13-to-five Republican majority even though Democratic candidates for the House received more votes.
And on a note that is both highly symbolic and deeply important, this new map means that there are now 25 Republican-held House seats nationally that Hillary Clinton carried, up from 23. That’s one more than the number of Republican seats Democrats would need to flip in order to regain control over the House in November.
Below is another version of the court’s new congressional map, this time overlaid on top of the county borders so that you can see which county is part of which districts. Overall, people in just 13 counties and 18 municipalities are split between two or more districts. That’s far fewer than under the GOP’s invalidated gerrymander, which divided 28 counties and 68 municipalities. You can also find more information on county and district correspondences in this table.
 Click to enlarge


