The White House wants to trumpet economic growth for the 2nd Quarter — which, at 4.1%, was faster than growth in any quarter since … 2014. The tax cut fueled economy is less a sensation than expected, and has not shown growth in GDP (gross domestic product) that beats the quarter-to-quarter gains during the Obama period. And the first quarter growth, 2.2%, was unremarkable. Check the charts, see for yourself.
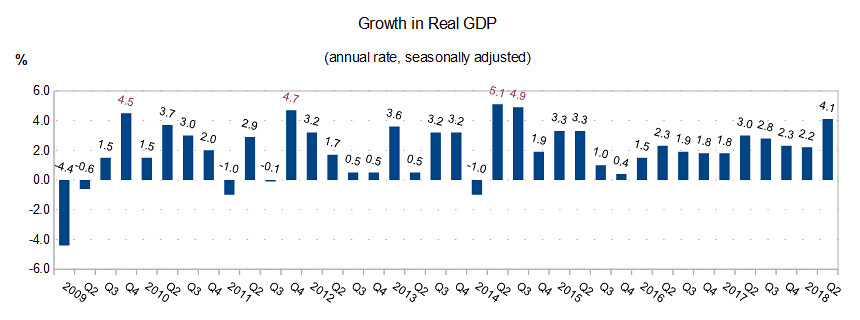 Source data: Bureau of Economic Analysis
Look beyond the output (gross domestic product) track. The picture for jobs, and Unemployment, also shows a glide path that extends steadily from the six years prior.
Here’s the civilian Unemployment rate, showing improvement each December-to-December since 2010 (and through to the most recent month, in June).
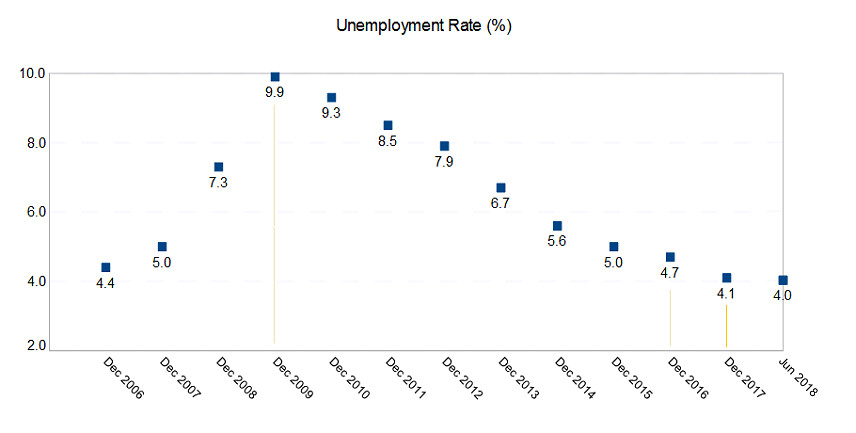 Unemployment rate, year-end (and June). Source data: Bureau of Labor Statistics
You can see, the rate of Unemployment plummeted from 9.9% in December 2009, to 4.7% during Obama’s last full month in office — falling a full 5 points from the recession at the start of his presidency in 2009.
In 2017, Trump’s first year, unemployment fell from 4.7% to 4.1%, and continued a slight improvement through the first half.
At 4%, the unemployment rate last month is near the low of April 2000 (3.8%) during the Bill Clinton presidency.
If you look at unemployment trends by demographic breakdown, you’ll see a similar continuation of gains from the years preceding. Here is for African-Americans:
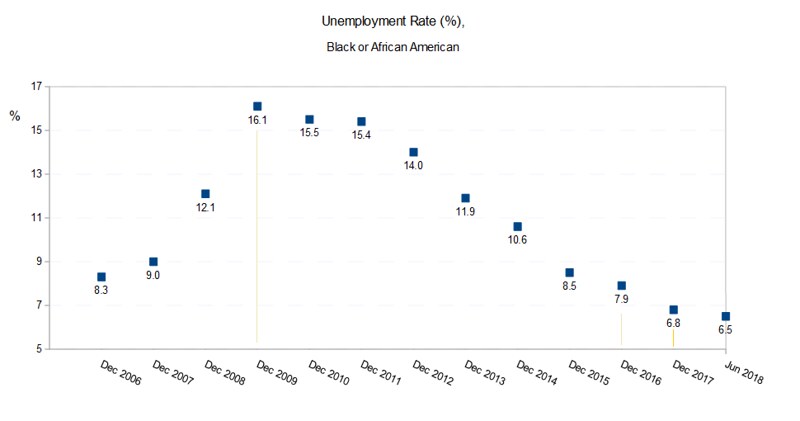 Unemployment rate, Year-end (and June), black/African-American. Source data: Bureau of Labor Statistics
Unemployment for Blacks, under Obama, was sliced in half from early in his term, from 16% at the end of the first year of his presidency, during the tail end of the 2008-2009 recession, to just under 8% in the last month of 2016.
Here are the numbers of new jobs created.
The chart shows change from year ago.
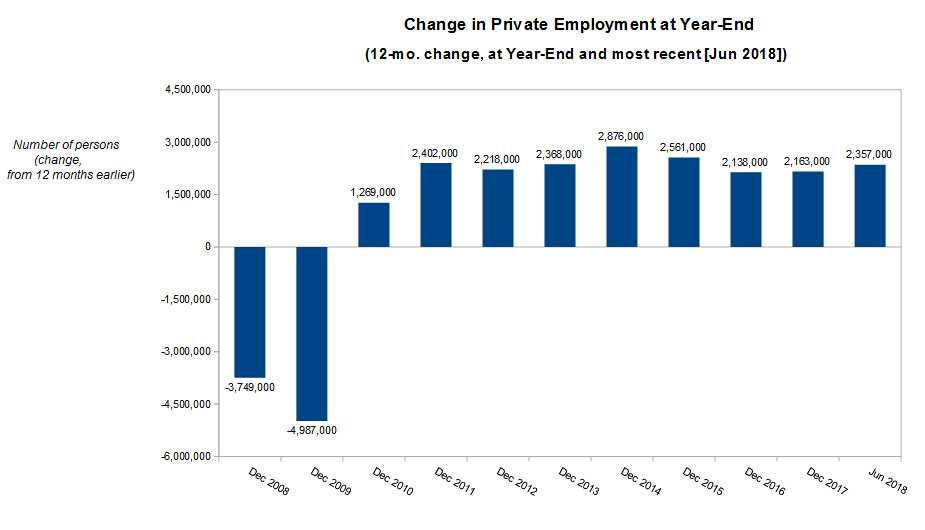 12-month Change in Private Sector employment. Source data: Bureau of Labor Statistics
During the Obama recovery, the average year-to-year gain in private sector jobs from December to December was 2,262,000 employees per year, or 2,427,000 per year after 2010 on average, from 2011 to 2016 (because 2010 had half as much gain as all the years that followed). At the end of Trump’s first year: the bump was 2,163,000.
The employment/ unemployment charts above are ones I constructed, showing year-end data. For simplicity, and going straight to the source, here are charts straight off the web pages of the Bureau of Labor Statistics for monthly unemployment — from this page link (for total; and latino/Hispanic; black/African-American; Asian-American). The figures are accessed from the single link, then click on the each heading, e.g., for “Hispanic or Latino”, or for “Total”.
The 4% unemployment rate overall, which has been at an 18-year low, has followed the steep decline seen since 2010.
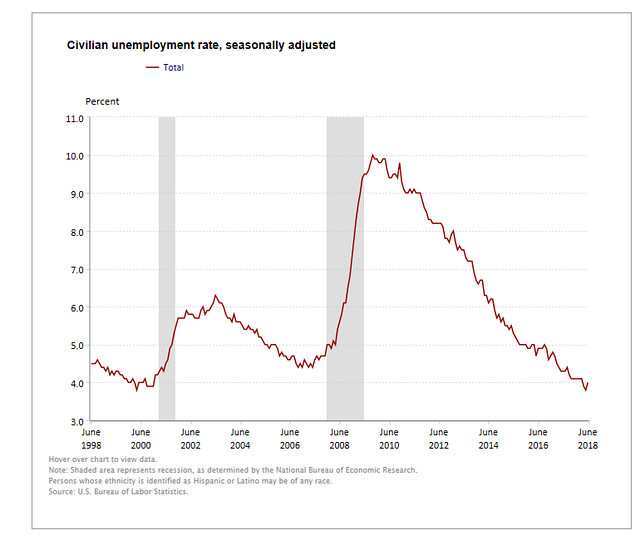 Total Civilian unemployment rate (%). BLS link: https://www.bls.gov/charts/employment-situation/civilian-unemployment-rate.htm#
Here are the figures for the Hispanic labor force.
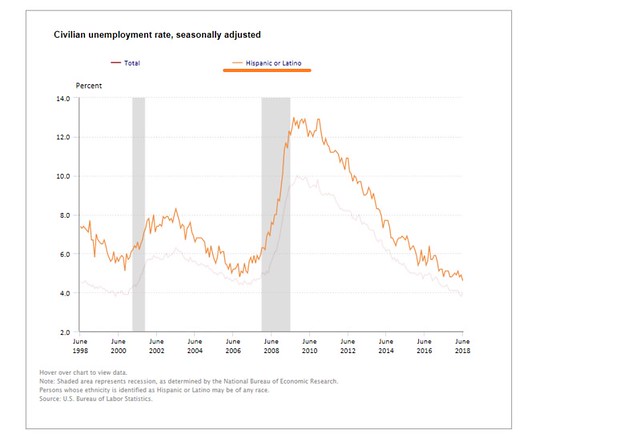 Unemployment rate (%), Hispanic/latino. Link: https://www.bls.gov/charts/employment-situation/civilian-unemployment-rate.htm#
Here is the unemployment rate for blacks/African-American.
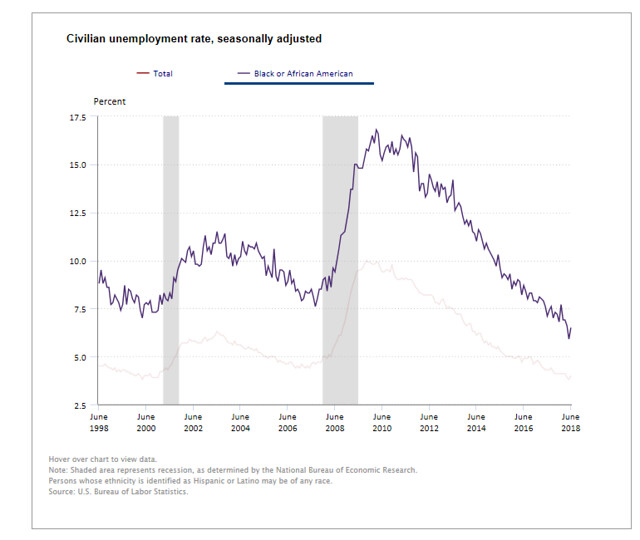 Unemployment rate (%), black/African-American. BLS link: https://www.bls.gov/charts/employment-situation/civilian-unemployment-rate.htm#
Here is for Asian-Americans.
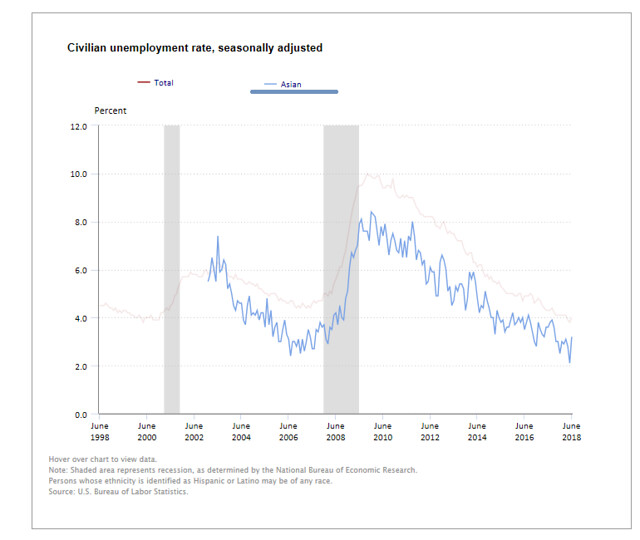 Unemployment rate (%), Asian-Americans. BLS link: https://www.bls.gov/charts/employment-situation/civilian-unemployment-rate.htm#
Here is the figure for youth unemployment, age 16-19 years old.
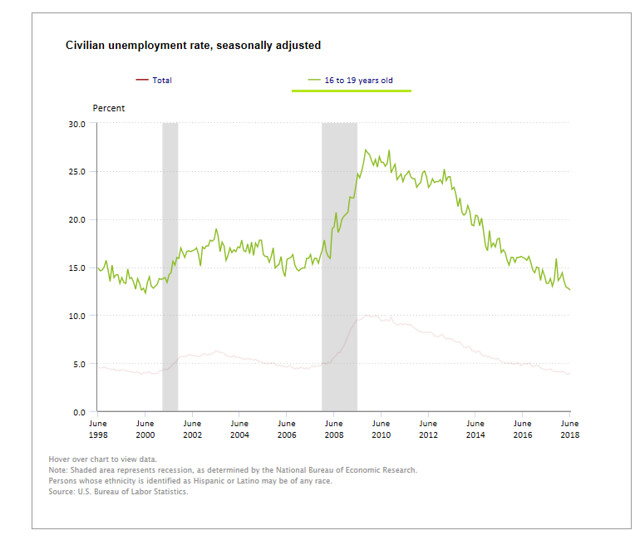 Unemployment rate (%), 16-19 years old. BLS link: https://www.bls.gov/charts/employment-situation/civilian-unemployment-rate.htm#
As for Friday’s news release of 4.1% output growth in the April-June quarter, the figure seems to be misunderstood versus recent economic history.
There were 15 quarters during Obama's administration when GDP growth surpassed 2 percent, The TheHill writes, countering Don Jr’s twitter feed to the contrary (and citing also theWeek publication):
“Donald Trump Jr. falsely claimed that quarterly gross domestic product (GDP) growth never passed 2 percent under former President Obama — even though it did 15 times, The Week noted on Friday.
There were eight quarters of growth of at least 3 percent (during Obama’s presidency), including three of 4 percent or better.
The highest GDP growth of Obama's presidency was during the third quarter of 2014, when it hit 5.2 percent.” Note: Don Jr. literally did tweet on Friday, “Just because Obama never broke 2% doesn't mean that someone with great policies can't.”
Also, the spurt in GDP may be a one-off, due especially to acceleration of exports and trade flows — to beat the clock on threatened tariffs.
Shipments of exports were accelerated to beat retaliatory tariffs imposed by China, including for farm products such as soybeans. Accelerated exports included a 50% rise in soybean exports in May from a year earlier. This is pulled up from the next quarter into the last.
… will provide what may be the biggest quarterly contribution in nine years. Morgan Stanley points out that soybean exports are up almost 9,400% on an annualized basis over the past three months. That’s not going to last. — Marketwatch
Also, note the deficit-yawning tax cut enacted for this year adds a huge forward risk to the outlook — because it is pro-cyclical, and it is adding stimulus to a mature business expansion. That is, the tax cut amplifies the expansion.
However, fiscal policy is supposed to be counter-cyclical, particularly when the expansion gets aged and the economy starts to contract. That’s when fiscal stimulus (tax cuts or spending increases) will be needed. If we’ve already blown the deficit and tax cuts in a pro-cyclical economic move, we’ll have no fiscal policy tool to right the economy when it heads into a downturn.
On top of that, Trump’s vindictive immigration policy will literally wall off social security for future generations.
Consider: a limited-immigration scenario shortens slightly the actuarial life of the SS trust fund compared to baseline, because immigrant families are younger than the overall working-age population, on average, and have higher fertility rates than do second- and third-generation households. Social security always depends in part on the next generations funding the last, and in part on the taxes workers have always paid in to the fund.
A Trump economic burst may be short-sighted.
Yet, Trump claims he’s achieved an “economic turnaround of historic proportions.” If you look at the charts and data, you may not spot the turnaround.

