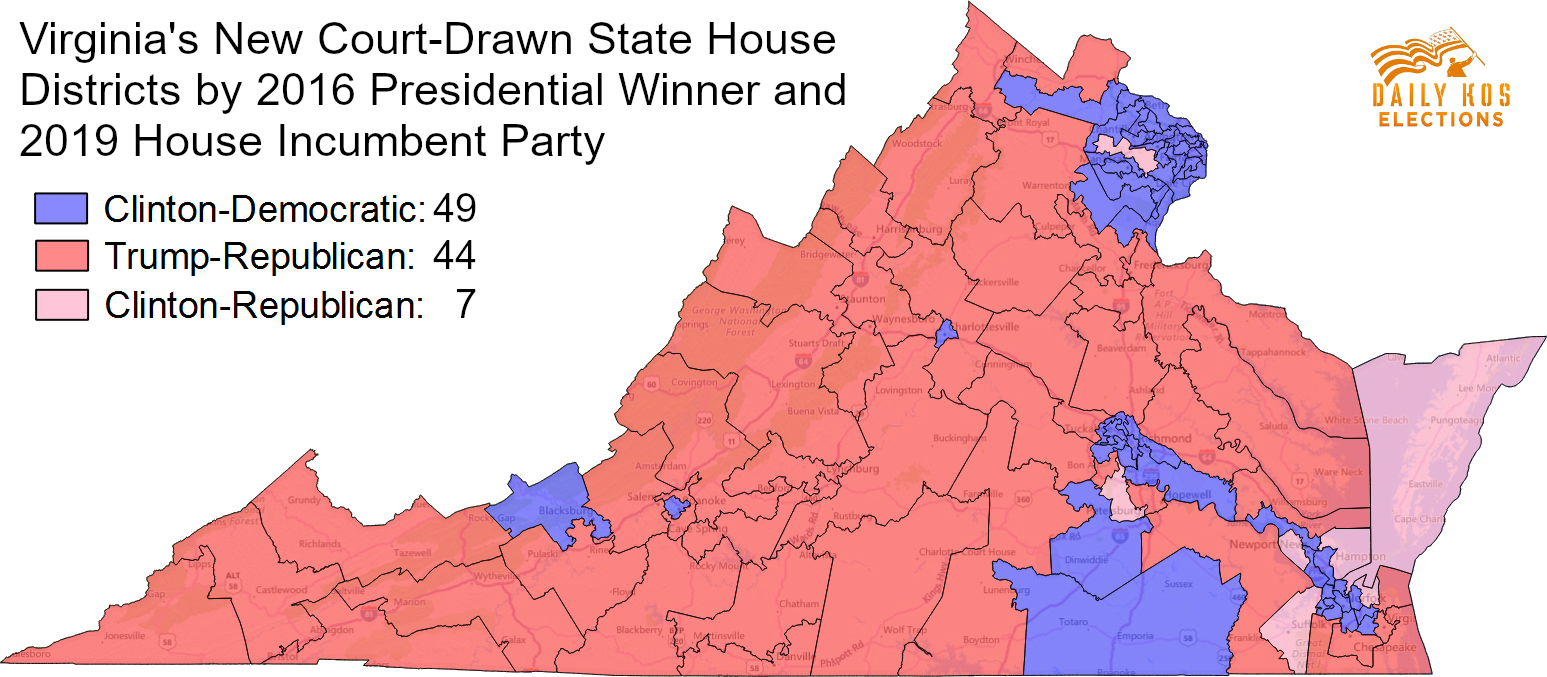
On Tuesday, the federal court that last year struck down 11 Republican-drawn state House districts in Virginia for unconstitutionally diminishing the power of black voters ordered the adoption of a replacement map to remedy the GOP’s now-invalid gerrymander. The court’s map is similar to the Democratic plaintiffs' proposals and makes changes to more than two dozen of the chamber’s 100 districts, since many of those adjacent to the illegal districts need to be redrawn as well.
As a result, this map would give black voters greater clout in several districts, consequently making several Republican-held seats considerably bluer ahead of this November's elections. In fact, as you can see in the map at the top of this post (see here for a larger version), Hillary Clinton won 56 districts to just 44 for Donald Trump, a big jump from Clinton’s 51-49 advantage under the old lines.
In the House, Republicans are clinging to a 51-49 edge. As the map below demonstrates, none of these 49 Democratic incumbents would hold Trump seats (currently one does). On the flip side, seven Republicans would be placed into Clinton districts, compared to just three right now: Tim Hugo (HD-40), Kirk Cox (HD-66), Chris Jones (HD-76), Christopher Stolle (HD-83), Gordon Helsel (HD-91), David Yancey (HD-94), and Robert Bloxom (HD-100).
 Click to enlarge
In a fitting twist, Cox is the state House speaker, and his district would flip from backing Trump heavily to voting for Clinton by a 50-46 margin. And as analyst Chaz Nuttycombe notes, Jones was the architect of the GOP’s original map that the courts struck down, while Yancey infamously won re-election in 2017 thanks to a tiebreaker that never should have happened in the first place. Democrats could therefore enjoy a whole lot of karma on their way toward winning their first majority in more than 20 years.
Note: We were able to calculate these results thanks in part to work by the Princeton Gerrymandering Project, which has put together an interactive graphic that lets you toggle between the invalidated districts and the redrawn ones, which are centered around Richmond and Hampton Roads. We then combined Princeton's data with our own previous calculations for the seats that weren't redrawn. We’ve also uploaded a GIS shapefile of the map available for download that includes presidential results and incumbency status for each district.


