For this diary, we take you to Massachusetts, the birthplace of the gerrymander. For those that don't know, the word "gerrymander" was named after a redrawn State Senate map approved by Gov. Elbridge Gerry (Democratic-Republican) in 1812 that produced a district in Massachusetts' North Shore that resembled a wyrm or a salamander in order to bolster the Democratic-Republican Party. Here's the famous political cartoon of this district from a pro-Federalist newspaper:

Needless to say, it worked. Despite narrowly losing the Presidential Election of 1812, the Federalist Party ticket (led by DeWitt Clinton) won Massachusetts in a landslide (and they picked up the Governor's office and the MA State House), but the State Senate remained fully in Democratic-Republican control.
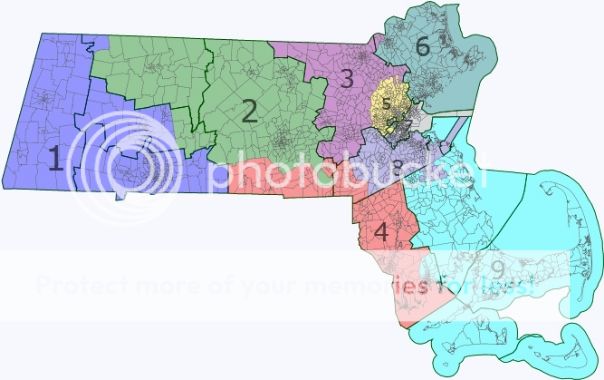
In 2011, Massachusetts Democrats redrew the state in a Democratic gerrymander. However, for the most part, their aim was more towards patronage than partisan intent. Although they drew 9 districts with a definite Dem lean, a few are more wobbly than I'd like. One district (MA-06) was made a bit less Dem to the peril of embattled Democrat John Tierney (who has a bunch of crooks as in-laws that were eager to drag him down with them). Another district (MA-04) was drawn a little less Dem and encouraged Barney Frank to retire earlier than he was hoping to. However, they did shore up Bill Keating in his Cape Cod and Plymouth-based district and Niki Tsongas in her Middlesex County-based district. Of course, since Massachusetts had to lose a seat, John Olver and Richard Neal were drawn together in the western part of the state (Olver was retiring, though). Here's the map:

Backstory aside, what I wanted to do in this diary is to show three purely hypothetical maps under three different scenarios: A. A Republican gerrymander. B. A (more effective) Democratic gerrymander. C. A court or commission-drawn map.
Maps and analysis below the fold.
Map 1: Republican Gerrymander

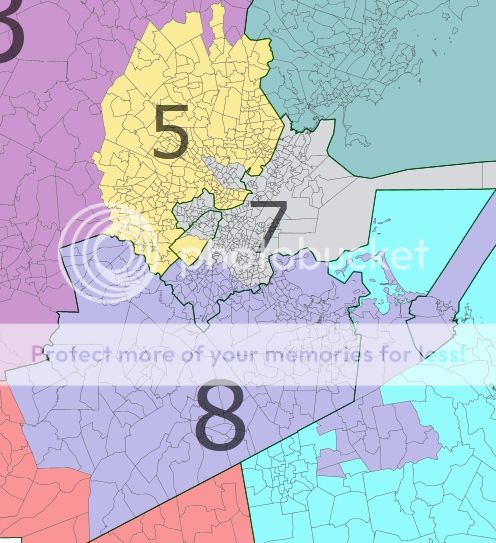
Boston metro view:

North-east view:

Middlesex County view:

MA-01 (blue): Richard Neal (D-Springfield)
70.3% Obama/27.5% McCain
62.4% Avg D/37.6% Avg R (Note: The Avg D vs. Avg R numbers are skewed rightwards as the formula was derived from Dem performance in 2010 where Dems did well, but Republicans did better than usual.)
Western Massachusetts had not voted Democratic for Congress until John Olver's victory in the 1991 special election to replace the late Rep. Silvio Conte. Now, western MA is one of the most Democratic parts of the state. In her Senate race in 2012, Elizabeth Warren won every town in Berkshire County and swept most of Franklin and Hampshire County. In 2011 redistricting, Richard Neal of Springfield was drawn together with John Olver of Amherst (a process helped along by Olver's announcing retirement). This map does the same, but makes the resulting MA-01 4-5% bluer.
MA-02 (green): Open
51.0% Obama/47.0% McCain
37.2% Avg D/62.8% Avg R
This district carves out the Republican parts of Hampshire County from around Springfield, takes in the purple and red parts of Worcester County, and ends in the reddish areas of Norfolk County. This district would probably have only very narrowly voted for Obama in 2012. Possible Republican candidates include St. Sen. Richard Ross, St. Sen. Michael Knapik, ex-Sen. Scott Brown (fat chance), and Worcester County Sheriff Lew Evangelidis. There is a fairly good Democratic bench here too, but it would take a strong fight to win.
MA-03 (dark magenta): Rep. Jim McGovern (D-Worcester) and Rep. Niki Tsongas (D-Lowell)
63.0% Obama/35.2% McCain
50.6% Avg D/49.4% Avg R
Both congressmen are drawn together into a single, snaking district that also takes in Lawrence. I'd have to imagine that Tsongas has more of her old territory here than McGovern, but McGovern has stronger support.
MA-04 (red): Rep. Ed Markey (D-Malden)
65.6% Obama/32.7% McCain
55.5% Avg D/44.5% Avg R
Ed Markey's district becomes bluer and reddens MA-06 by taking in Lynn, Salem, Beverly, Peabody, and Swampscott.
MA-05 (gold): Rep. Mike Capuano (D-Somerville)
80.8% Obama/17.7% McCain
74.6% Avg D/25.4% Avg R
It doesn't change a whole awful lot, but that's to be expected with a region that's dark blue and trapped inside of a blue suburban ring.
MA-06 (teal): Rep. John Tierney (D-Salem)
53.4% Obama/44.9% McCain
39.5% Avg D/60.5% Avg R
Tierney would have surely lost a district like this, but of course he would not even live in this iteration. It's actually only ~3% less Democratic the real MA-06 since once you leave Essex County, it's hard to find red area beyond Billerica and Tewksbury.
MA-07 (dark grey): Rep. Stephen Lynch (D-Boston)
67.2% Obama/31.2% McCain
57.7% Avg D/42.3% Avg R
His district gains Brookline and the blue suburbs of Framingham, Newton, and Quincy.
MA-08 (slate blue): Rep. Joe Kennedy III (D-Brookline)
63.9% Obama/34.3% McCain
52.2% Avg D/47.8% Avg R
Although Patrick Kennedy doesn't live here, it's not a far cry from the MA-04 he currently represents. I tried to turn this into another R district by doing exchanges with MA-02, but I could only get it down to like 59% Obama. So it stays as a final Dem vote sink, taking in Dukes and Nantucket County from MA-09 as well as Brockton, Randolph, and Sharon.
MA-09 (cyan): Rep. William Keating (D-Bourne)
52.1% Obama/46.4% McCain
39.8% Avg D/60.2% Avg R
Bill Keating could hold on in this district, but he'll have to campaign very hard to hold it. It would be a Republican-leaning district in an open-seat scenario, that's for sure.
* * * * * * * * *
Map 2: A Stronger Democratic Gerrymander

Zoom in on North Shore:

Zoom in on Boston metro area:

Zoom in on SE Massachusetts and the cape:

MA-01 (blue): Rep. Richard Neal (D-Springfield)
63.3% Obama/34.5% McCain
52.7% Avg D/47.3% Avg R
This district becomes a few points redder than the actual map by taking in none of Franklin County and only a minority of Hampshire County and absorbing tracts of red townships in Worcester County.
MA-02 (green): Rep. Jim McGovern (D-Worcester)
62.1% Obama/35.7% McCain
50.9% Avg D/40.1% Avg R
McGovern's district's Democratic strength is bolstered by Franklin County, Northampton, and Amherst. The only risk for McGovern is a primary challenge from the west. This is also a vast change from McGovern's 2003-2013 district which meandered from Worcester, went through a small part of Middlesex County, part of Norfolk County, and ended in Somerset in Bristol County.
MA-03 (dark magenta): Rep. Niki Tsongas (D-Lowell)
60.2 Obama/38.1% McCain
47.3% Avg D/52.7% Avg R
Tsongas' district doesn't change much from her real district, but it takes in red North Andover, loses portions of red Billerica and Tewksbury to MA-05, and extends southwards to take in all of solidly blue Framingham.
MA-04 (red): Rep. Joe Kennedy III (D-Brookline)
62.0% Obama/36.3% McCain
49.9% Avg D/50.1% Avg R
If Barney Frank really retired because of redistricting (rather than settling down with his husband), then he would have stayed in this district. It keeps all of very blue Fall River, Westport, and Dartmouth.
MA-05 (gold): Rep. Ed Markey (D-Malden)
62.1% Obama/36.3% McCain
51.7% Avg D/48.3% Avg R
This district becomes quite useful as it absorbs red areas like Walpole and North Reading, as well as parts of Billerica, Tewksbury, and Norfolk.
MA-06 (teal): Rep. John Tierney (D-Salem)
59.2% Obama/39.1% McCain
45.5% Avg D/54.5% Avg R
This district gets secure for Tierney as it gains light blue Haverhill and loses red North Andover. It also gains blue Melrose and trails some into Suffolk County to take in blue Winthrop, Revere, and very blue Chelsea. The great survivor of 2012 (many people had written him off for defeated when he stopped advertising in the last couple weeks) should be fine here.
MA-07 (dark grey): Rep. Mike Capuano (D-Somerville)
70.4% Obama/28.0% McCain
61.6% Avg D/38.4% Avg R
Capuano's district is unpacked to some of the light blue southern suburbs and the red interior of Plymouth County. I must have made it about 15% less Democratic than Capuano's real district.
MA-08 (slate blue): Rep. Stephen Lynch (D-Boston)
60.9% Obama/37.7% McCain
49.8% Avg D/50.2% Avg R
I don't think this would be a realistic district as it has the bulk of Plymouth County in it, and I'm sure a Dem primary challenger from there would emerge against Lynch. Not that it would necessarily be a bad thing, but he would probably not like it.
MA-09 (cyan): Rep. William Keating (D-Bourne)
59.6% Obama/38.8% McCain
47.5% Avg D/52.5% Avg R
Keating's district gives up much of Plymouth County (except for blue Brockton) and goes over to bluer Bristol County where it takes in New Bedford, Taunton, and finally comes to an end in very blue Randolph up in Norfolk County. Bill Keating was shored up in the real Congressional map, but this does a better job of it. His narrow victory over Republican Jeff Perry (who, as Sgt. of the Wareham PD in the 1990's, approved of a subordinate strip searching two minors) in 2010 was due to it being an open seat in what was then Massachusetts' least blue district with the Republican candidate being very well-funded.
* * * * * * * *
Map 3: Fair Map (Court-Drawn or Commission-Drawn)
Zoom in on Boston metro area:
MA-01 (blue): Rep. Richard Neal (D-Springfield)
66.8% Obama/31.1% McCain
57.6% Avg D/42.4% Avg R
I managed to draw this district without splitting a single town and came in only 53 under the required district population. Most of Hampshire County is included in it and the small towns of Monroe and Rowe in Franklin County are included.
MA-02 (green): Rep. Jim McGovern (D-Worcester)
58.9% Obama/38.9% McCain
46.8% Avg D/53.2% Avg R
This districts takes in the remnants of western Massachusetts and the vast bulk of Worcester County. McGovern will have to work a bit harder than usual to hold this district, but he should be fine.
MA-03 (dark magenta): Rep. Niki Tsongas (D-Lowell)
58.3% Obama/40.0% McCain
45.6% Avg D/54.4% Avg R
This district loses deep blue Lawrence over in Essex County to MA-06 (I'll explain why when I get to that district) and the only part of Essex County it keeps is a minority of Methuen. Aside from that, it takes in all of the outer rings of Middlesex County and nowhere else. I know county governments and borders are weak in Massachusetts, but I followed them anyway for the sake of neatness. Tsongas would have to campaign relatively hard, but I think she's pretty entrenched now.
MA-04 (red): Rep. Joe Kennedy III (D-Brookline)
57.1% Obama/41.0% McCain
42.6% Avg D/57.4% Avg R
Kennedy doesn't live here, but he could run here if he wants to. He was an astronomical fundraiser in 2012 and had a solid ground game. It's made up of most of Bristol County (including part of New Bedford), a corner of Norfolk County, and the southern border region of Worcester County. Republicans could actually win here, but it'll take a good year for them or a lousy Democratic candidate.
MA-05 (gold): Rep. Ed Markey (D-Malden)
68.6% Obama/29.7% McCain
60.2% Avg D/39.8% Avg R
This district is made up of the inner circle of Middlesex County (plus a piece of Brookline) and is very blue (partially because it has all of Cambridge).
MA-06 (teal): Rep. John Tierney (D-Salem)
59.6% Obama/38.8% McCain
45.5% Avg D/54.5% Avg R
I wanted this district to be all inside of Essex County (which is close to required district population itself) and it takes Andover, dark blue Lawrence, Haverhill, and the majority of Methuen. It's actually a bit bluer like this than in my Democratic gerrymander. Tierney would be very happy here.
MA-07 (dark grey): Rep. Mike Capuano (D-Somerville)
78.4% Obama/20.1% McCain
71.2% Avg D/28.8% Avg R
Capuano keeps his hometown of Somerville here in this district that includes most of Boston and Brookline.
MA-08 (slate blue): Rep. Stephen Lynch (D-Boston)
59.4% Obama/39.1% McCain
48.9% Avg D/51.1% Avg R
This district does not contain South Boston as Lynch would like and only includes the Boston neighborhoods of Roslindale, West Roxbury, and Hyde Park. It then takes in the suburbs to the south in much of Norfolk County and bleeds over a little into Plymouth County.
MA-09 (cyan): Rep. William Keating (D-Bourne)
56.2% Obama/42.3% McCain
44.0% Avg D/46.0% Avg R
This district has the vast majority of Plymouth County and only most of New Bedford. Keating should hold on fine here with robust campaigns, but he should not take it for granted.
* * * * * * * * *
Bonus: The First Gerrymander Re-Created
I have drawn up the district depicted in the famous "Gerry-mander" political cartoon
in the past, but that was before Obama/McCain numbers were uploaded to DRA. I also made the mistake of including all of modern-day Haverhill in it, when only the northern part of it was in the Gerry-mander (the southern part was the separate town of Bradford back in the early 19th century). Now that's fixed:

Drawn as a State Senate district back in 1812, this district would now comprise of 530,051 people today. In 2008, it went 60.6%-37.8% for Obama. Not bad, eh?

Thu Feb 14, 2013 at 2:41 PM PT: I decided to fix up the fair map some using suggestions from the comments. Here is the revised fair map:

Boston Metro:

North Shore:

Southeast Massachusetts and the cape:

Thu Feb 14, 2013 at 6:34 PM PT: Here are the 2008 Presidential Election result statistics and 2010 average partisan performance for the revised fair map districts:
MA-01: 69.0%O/28.9%M; 60.8%D
MA-02: 56.2%O/41.6%M; 43.0%D
MA-03: 58.0%O/40.3%M; 44.7%D
MA-04: 58.5%O/39.8%M; 46.7%D
MA-05: 73.6%O/24.7%M; 66.5%D
MA-06: 57.8%O/40.6%M; 44.2%D
MA-07: 76.3%O/22.3%M; 68.7%D
MA-08: 56.2%O/42.0%M; 41.5%D
MA-09: 56.8%O/41.7%M; 45.1%D

