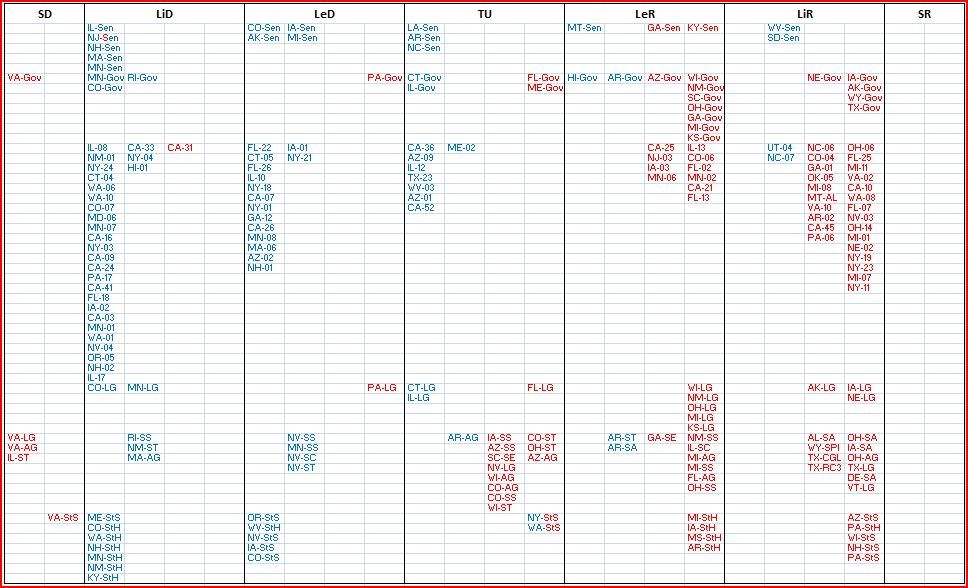
This is my rating chart updated to April 1, 2014:
Click in the image, to see it in larger size. First it will open the image in photobucket and then you can zoom to see the image in the natural size.
First a few notes about the chart.
NOTES
This model of rating chart includes habitually:
- The rating of the presidential election by state (obviously not for 2014).
- The rating for the US Senate races.
- The rating for the Gubernatorial races.
- The rating for the US House races.
- The rating for the Lieutenant Governors that run in the same ticket than the Governor.
- The rating of the statewide elected offices including the separately elected Lieutenant Governors.
- The rating for who will win the majority of the state chambers.
Note: Many people is focused only in a few levels but I think every level has the own importance.
Also in every rate there are 4 columns:
- The first for offices with Democratic incumbent.
- The second for the offices open by a Democrat.
- The third for the offices open by a Republican.
- The fouth for the offices with Republican incumbent.
Note: The SafeD and SafeR groups only have the columns for the offices of the opposite party.
In the group of the statewide elected offices the races are named by the reference to the state and the first letters of every word:
- LG: Lieutenant Governor (in the case of the LG elected separetely).
- SS: Secretary of State.
- AG: Attorney General.
- ST: State Treasurer.
- SA: State Auditor.
- SC: State Comptroller.
- SE: Superintendent of Education (SC and GA)
- SPI: Superintendent of Public Instruction (WY)
- CGL: Commissioner of General Land Office (TX)
- RC3: Railroad Commissioner 3 (TX)
There is a color code that talk about the party that hold the office in the cycle. As example you can see the case of NJ-Sen. First blue (F Lautenberg D), later red (J Chiesa R) and finally blue (C Booker D). Also it talk about the change in the senate majorities of WA and NY thanks to the defection of some Democrats, and can talk also about the possible change in FL-13.
Then the chart for the 2013-14 cycle is covering:
- 36 senate races
- 36 gubernatorial races
- 435 us house races
- 172 statewide elected offices (including all the Lieutenan Governors)
- 90 majorities in state chambers
Total = 769 (without count some cases of double elections in the cycle like in FL-13)
It is a too big number to make comments race by race in the diary.
Some races that have been done before the april 1 appear in the chart as safe at this point, to make easier a net count of gains and loses for the entire cycle.
This rating chart is calculated only following numerical rules that I designed for it. The rumerical rules are symetric and are the same for every case. It assures a not biased approach to the rating of electoral races. The numerical rules used are not totally fixed. After the last diary I made a little improvement in the numerical traslation of the case of an incumbent retiring in "hostile" territory according to the PVI. The consequence of this change is the rating chart reacting faster to this kind of retirements with CA-31 moving from LeD to LiD and NC-07 and UT-04 moving from LeR to LiR.
As a chart with numerical origin, it is done with the public data until april 1 (in this case. It can be considered like a picture of the current situation and also is used in a predictive way as the election data gets closer. Updating the chart until the election day, the chart becomes a strong tool for me to predict the final results of every race.
Comparing the rating charts of DKE where they are rating 507 races, and this chart, at this point there are only 4 disagreements (0.78%) in more than one cathegory (FL-22, WV-02 and MN-06 in 2 cathegories, and the special case of HI-Gov where the alone poll published is shocking, very weird).
CONCLUSIONS
In the previous edition of this diary (february 25) I explained longer how is looking the overall picture of the cycle.
As resume we can say that the chance of winning new offices for the Democratic party is higher in the gubernatorial, in the statewide and in the state chamber levels (the incumbents come in many cases from the 2010 elections). In the US House the trend is very close to a tie, with maybe some net lose for the Democratic Party (the incumbents come from the 2012 elections. And the prospect is more difficult in the US Senate level, with likely loses (the incumbents come from 2008, a more favourable year). The Republicans are just focused in the US Senate level this year, in order to win the majority, and the fundraising data are confirming it.
Also, most of the races in the competitive range are in the blue states (states with D+ PVI) and here is where we will have most of the action this cycle in quantitative terms. It is necessary to remember that some EVEN and R+ US House districts are also in blue states. Between the blue states, only RI, MD, DE and VT have not races in the competitive range, but DE-SA and VT-LG can become competitive by November (it would be so sad if not, taking into account the nature of both states).
Habitually the D+ US House districts in EVEN and R+ states are not difficult for the Democratic Party, but thanks to the Republican redistricting of many states there are only a few, and are blue enough to be not competitive. In the EVEN and R+ states, the overall prospect is worse, and the number of competitive races is a lot lower, but with very important senate races in qualitative terms.
In the last weeks we have the FL-13 special election. The result of this race agrees with the result of previous elections like VA-AG. It is a confirmation that the cycle goes very close to a tie between both parties, and only a little worse for the Democratic Party than 2011-12. It was a good opportunity for a gain from the Republicans, surely one of the best that the Democratic Party will have this cycle, but still not enough good to win.
Also in the last weeks we have new data that moved the rating of some races. Check the new chart it if you are interested.
I think we can conclude that the defensive side of the cycle is going well. There are only a few offices in Democratic hands endangered, but with some very important senate seats included. The defense of the majority in the senate will require a lot of work, but also the Republicans need a lot of effort to win in this fight.
At this point, with the current numbers I see the majority in the US Senate in Democratic hands after 2014. They have not it done. While other parts of my rating chart have a slower reaction, the part of the senate reacts faster because there are more public numbers and new numbers appear in feew days.
I'm confident about a good result in CO-Sen and IA-Sen. I also think that MI-Sen will have a good result if the Democratic Party take nothing for granted and works strongly the fundraising side.
For me NC-Sen will be a key race. A strong deffense must begin fast. As strong as the attacks to K Hagan are. The Democratic Party needs to keep this seat in a R+3 state. It should be a lot easier than the rest of the seats in R+.
I have less confidance about AK-Sen, LA-Sen and AR-Sen. The runnoff in LA requires an aditional effort in LA-Sen. Surely AK-Sen can be the 50 seat for the Democratic Party. And looking at the current numbers I would not rule out to finish the cycle with more than 50 seats after the elections of November.
Tue Mar 25, 2014 at 9:05 PM PT: The rating chart of the begin is updated to March 25. In the last week the alone change is NM-Gov and NM-LG going from LiR to LeR.
Tue Apr 01, 2014 at 11:48 PM PT: The rating chart and the diary are updated to April 1. In the last week, there are 3 changes in the ratings. GA-Gov from LiR to LeR, VT-LG from SR to LiR and MI-08 from SR to LiR.
Mon Apr 07, 2014 at 10:15 AM PT: I was missing a little data that is enough to move the rating of NJ-Sen from Likely D to Safe D. Like I have done other changes in my table after the April 1, I can not update the image to include this little change for NJ-Sen.
