I plan to post a South Carolina primary preview some time later today or tonight, similar to the Nevada primary preview from last time.
Hillary Clinton remains the frontrunner for the Democratic nomination, and Bernie Sanders remains the upstart challenger. Although Sanders has gained tremendous ground in the polls since he announced his candidacy, Clinton is ahead in the Pollster national poll average by 49-42, and ahead in the Real Clear Politics poll average by 47-42. Moreover, some of Clinton's strongest states are about to start voting. That begins with South Carolina, where Clinton should win by about 20 points. After that, 11 states vote on Super Tuesday (March 1) and then primaries and caucuses across the rest of the country will follow in relentless succession, all the way until June.
Given all this, it won't be easy for Sanders to win the Democratic nomination. The odds are stacked against Sanders, but in this diary we will analyze the path by which he could nonetheless win the nomination. That’s not to say that this is necessarily what will happen, but rather is to say that if Sanders does win the Democratic nomination, this is probably roughly how he will do it.
We'll game out what the worst case scenario for Sanders would look like in which Clinton does very well in South Carolina and on Super Tuesday, but in which it is nonetheless still (just ever so barely) possible for Sanders to come back and pull out a narrow win, capped off on June 7 with epic wins in California, Montana, New Jersey, New Mexico, and South Dakota.
And we’ll also game out a more likely scenario for a possible Sanders win, in which he improves slightly over what current polls suggest by Super Tuesday, and in which he then continues to gradually gain further ground over the course of a long marathon national primary.
The main points we will make are:
- The primary calendar is tilted in such a way that even if Sanders wins, Clinton will pull ahead in the pledged delegate count after March 1 and March 15 — perhaps by a lot.
-
On Super Tuesday alone, the shift in the states that are voting as compared to the states that voted in 2008’s Super Tuesday is enough to "artificially” expand Clinton's delegate margin by about 40 to 55 delegates. Of course, that is just a temporary effect, but it will make it appear that Clinton is doing better than she actually is. Similar sorts of biases apply to the rest of the calendar through March 15 (though I haven’t bothered to try and quantify it).
-
Sanders can win even without winning any states in the South at all. He also can afford to do without at least some states in the North, Midwest and West (including some big ones, like Michigan, Illinois, Pennsylvania, and New York). Of course, the margins do matter. While he doesn’t need to win all such states, he does need to win some, and he needs for Clinton not to win blowouts in those sorts of states.
-
The intricacies of delegate allocation thresholds matter, and not just the pure popular vote. In any close race, we’ll probably see some more weird delegate allocation situations such as Sanders winning Ohio but Clinton winning more delegates.
- In order for Sanders to win, it probably has to be the case that the concept of “momentum” doesn't apply (or at least does not apply very strongly) to a two person race, as opposed to in a multi-candidate race like the 2004 Democratic primary or the last few GOP primaries. The dynamics have to be similar to 2008. But there are some reasons to believe that this may be what happens.
-
In any scenario in which Sanders wins, he probably won't pull ahead in delegates until June 7. Under that scenario, California will decide the nomination.
-
In any scenario in which Sanders wins, he will almost certainly hold a reasonably sized lead in the national polls (i.e., probably at least 3 points). That is because Sanders will have to be leading nationally in order to come back at the end of the calendar. That means that it is probably substantially less likely than commonly thought that superdelegates would be willing to give the nomination to Clinton if Sanders wins the most delegates — because to do so they would have to blatantly override the majority preference of the people (at the time of the convention, as opposed to at the time in which the earlier states voted).
The current state of the race
But before we get to that, let's get an overview of the current state of the race and provide the background context that we’ll need to understand Sanders’ potential path to victory.
The chart below shows the current state of the race, as estimated by my model. The model uses national polls, state polls, and demographic data from exit polls and from the census to make these projections (for more details see the links at the bottom of the diary). This is a picture of a static race given that the current polls stay the same. If a national primary were held today, my model predicts that its outcome would look something like this:
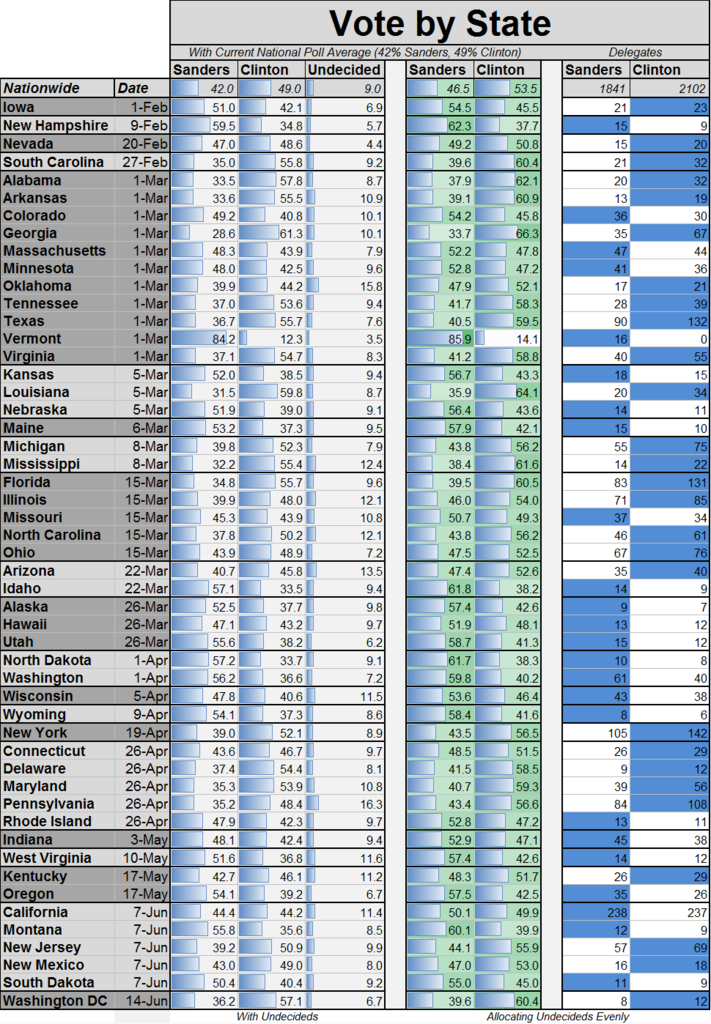 Delegates by state with a static 49-42 Clinton national lead
As a reminder, my model does not include delegates from US territories and Puerto Rico. They could potentially make a difference in a close nomination contest, but are not possible to model on the basis of polls and demographics.
Clinton starts with a 1 delegate lead out of a total of 103 delegates. The model currently projects Clinton to win by a bit more than 20 points in South Carolina and then to win 7 of the 11 Super Tuesday states (including winning a number of the southern states by around 20 or more points). It projects 2102 delegates for Clinton and 1841 for Sanders.
Another useful way to look at this is to group states that vote on the same day together and track the total delegates. The chart below shows the same information as the state-level chart above, but aggregated by the date each state is voting. A bit further below I have aggregated total delegates by month:
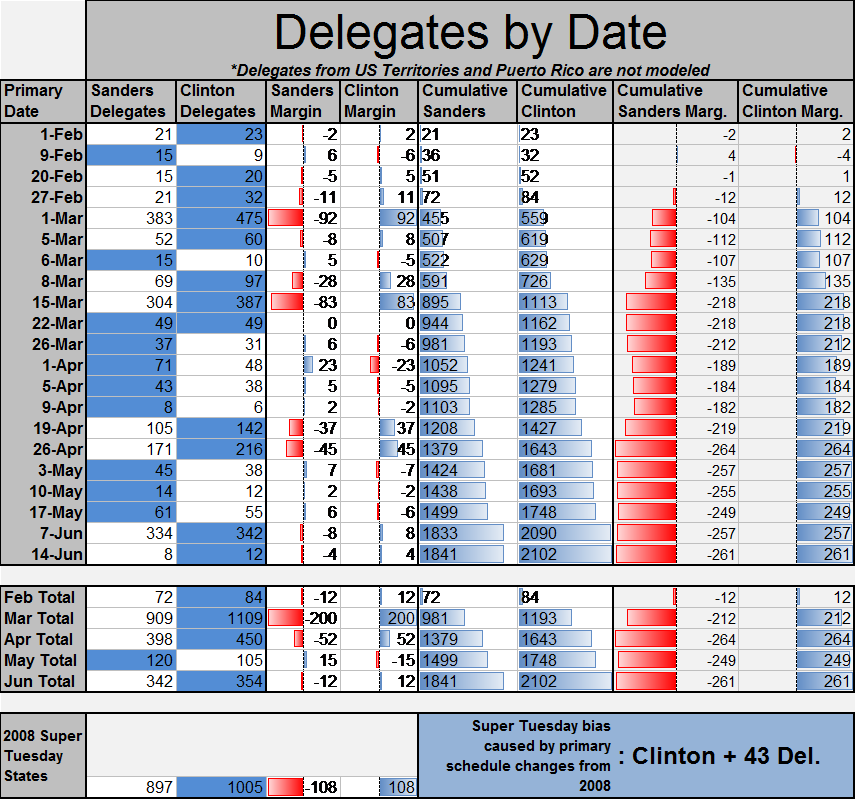 Delegates by date with a static 49-42 Clinton national lead
If nothing were to change prior to South Carolina on Feb 27 and Super Tuesday on Mar 1, the model predicts that Clinton would win South Carolina by 32 delegates to 21 (a margin of 11) and would win the 12 Super Tuesday states by a net of 475 to 383 delegates (a margin of 92 delegates), giving Clinton a substantial 104 delegate cumulative margin by the morning of March 2.
One interesting and important point to note is that in an entirely static 49-42 race, Clinton would already have 218 out of her final projected margin of 261 delegates (fully 84%!!!) by March 15, despite the fact that only 2008 out of the 3943 (53%) pledged delegates elected by the 50 states + DC will have been determined. That, again, is a reflection of the extraordinary extent to which the primary calendar is set up so that Clinton's strongest states will almost all vote by March 15, whereas most of Sanders’ strongest states will vote after that.
In this static scenario, despite still leading by 7 points nationally, Clinton would then start to lose a bit of ground in late March and early April as a string of states particularly favorable to Sanders starts voting, before making it back up when New York votes on April 19. From that point, Clinton would expand her margin only by a bit more.
The final thing shown at the very bottom of the chart is how the 2008 Super Tuesday states (as opposed to the 2016 Super Tuesday states) would be projected to vote. Whereas Clinton would be projected to win 55.4% of the delegates from the 2016 Super Tuesday states, she would only be projected to win 52.8% of the delegates from the 2008 Super Tuesday states.
To understand why this is so, first let's compare the 2008 Super Tuesday states and the 2016 Super Tuesday states. The 2008 Super Tuesday states were spread relatively evenly across the country:
2008 Super Tuesday Map
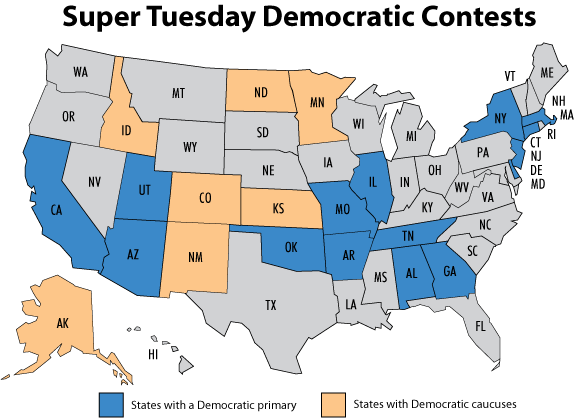 2008 Democratic Super Tuesday Map
2016 Super Tuesday Map
But the 2016 Super Tuesday states are much less representative of the country as a whole. In particular, there are many fewer Western states as well as somewhat fewer Northeastern and Midwestern states in 2016's Super Tuesday map than in 2008’s Super Tuesday map. And there are many more southern states. 8 of the 12 states (67%) of the one time Confederacy* will vote on Super Tuesday, while only 4 of the other 38 states (11%) of all the other states will vote on Super Tuesday:
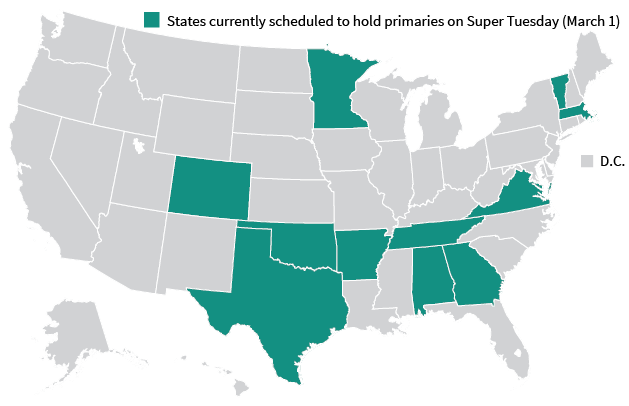 2016 Democratic Super Tuesday Map
* I’m a southerner and a Texan, with southern pride and particularly with Texas pride (don't mess with us). I use the boundaries of the former Confederacy to delineate the South not to degrade the South, but rather because it provides a clear definition of the South which means I don't have to arbitrarily decide whether to include border states like Marlyand, Kentucky, and Missouri in the south. Of course, Clinton's strong support in the South is not a result of southern racism — rather her support is coming in particular from African Americans — the ancestors of former slaves whom 20% of Donald Trump's supporters think never should have been freed. That contrasts with 2008, when Clinton did benefit from racist sentiments against Obama across the country, and particularly among white southerners.
And by March 15, all 12 states (100%) of the former Confederacy will have voted, while only 14 of 38 (37%) of all the other states (in the Northeast, Midwest, and West) will have voted.
Now, with that context, let's get back to the chart (I'll re-paste it below so you don’t have to scroll up):
 Delegates by date with a static 49-42 Clinton national lead
We can quantitatively estimate the bias in Clinton’s delegate lead that results purely from the change in the primary calendar by comparing Clinton's projected margin in the 2008 Super Tuesday states to her projected margin in the 2016 Super Tuesday states (by normalizing the total delegate count from the 2008 Super Tuesday states to be the same as the total delegate count from the 2016 Super Tuesday states so that there is a one-to-one comparison). Doing that, the result is:
With a national lead of 7%, we would expect Clinton’s delegate margin on Super Tuesday to be increased by an additional 43 delegates, solely attributable to the shift in the 2008 Super Tuesday map towards the South between 2008 and 2016.
In fact, if Sanders narrows the gap nationally to closer than a 7% Clinton lead, we will see further below that the quantitative magnitude of this bias actually increases further. This bias is only a temporary thing, of course. The more demographically favorable states for Sanders will still eventually vote — it is just that they vote later in the primary calendar. But what this does do is to inflate the numerical size of Clinton's delegate lead, even though 43 delegates of that lead simply come from the change in the scheduling of which states vote on Super Tuesday. Note that there is also similar additional bias caused by the scheduling of other good states for Clinton between March 1 and March 15 that I am not calculating.
The consequence of the tilt in the primary calendar is that if one candidate's support is particularly concentrated in the South, then we should expect that candidate to build up a delegate lead on Super Tuesday and through March 15, even if that candidate is ultimately on course to narrowly lose the nomination. In fact, precisely this is true of Hillary Clinton's support — it is concentrated disproportionately in the South. National polls since November have consistently shown this to be the case, and it has also shown up in state polling. On the other hand, Bernie Sanders’ support is much more evenly spread throughout the rest of the country:
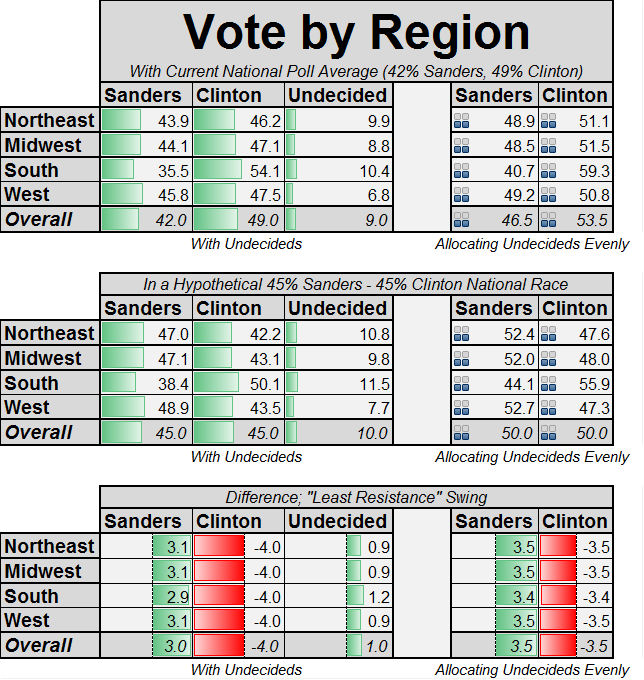 The model's projected vote by region, based on national polls since November
This is also consistent with the IBD/TIPP poll that came out earlier today, which shows Clinton up by 21 in the south, but down by 8 in the Northeast, 7 in the Midwest, and 10 in the West.
But while we should expect Clinton to emerge from Super Tuesday and through March 15 with a national delegate lead because of the bias in the primary schedule, there is actually another way in which the 2016 Super Tuesday schedule could help Sanders.
Whereas there were 1,664 delegates at stake in 2008’s Super Tuesday, there are only 858 delegates at stake in 2016's Super Tuesday. Since Sanders is currently behind, that means that he has a longer time period over which he can make up ground before many states that are most likely to be strong for Sanders vote.
For example, Obama lost California to Clinton by 8 points in 2008. But if California had been scheduled in June instead of on 2008’s Super Tuesday, Obama might well have been able to win California. If Sanders manages to gain in the polls by June, he may be able to ultimately get more delegates from California than he would if California voted on Super Tuesday — and those will be delegates that he will need in order to win the nomination.
A hypothetical 45-45 national dead heat
Next let's look at the static scenario of what the race would be expected to look like in a hypothetical national dead heat (45-45).
There is a change here that is worth noting from previous updates — in a tied national race, Sanders is now projected to get more delegates than Clinton (1982 to 1961). The opposite was true in previous updates. The way that delegates are assigned now appears to slightly help Sanders.
Why? Because more recent polling has suggested that Clinton's support is more strongly concentrated in particular states and Congressional districts (particularly in the South) than appeared to be the case before. In a race with an even national popular vote, that works out to help Sanders slightly because it means that he would exceed more delegate thresholds in non-Southern states. As long as Sanders meets attains a basic floor of support in the south, (and that is a crucial caveat), increasing Clinton's margins in the South doesn't work out to give her may additional delegates, at least as projected by the model.
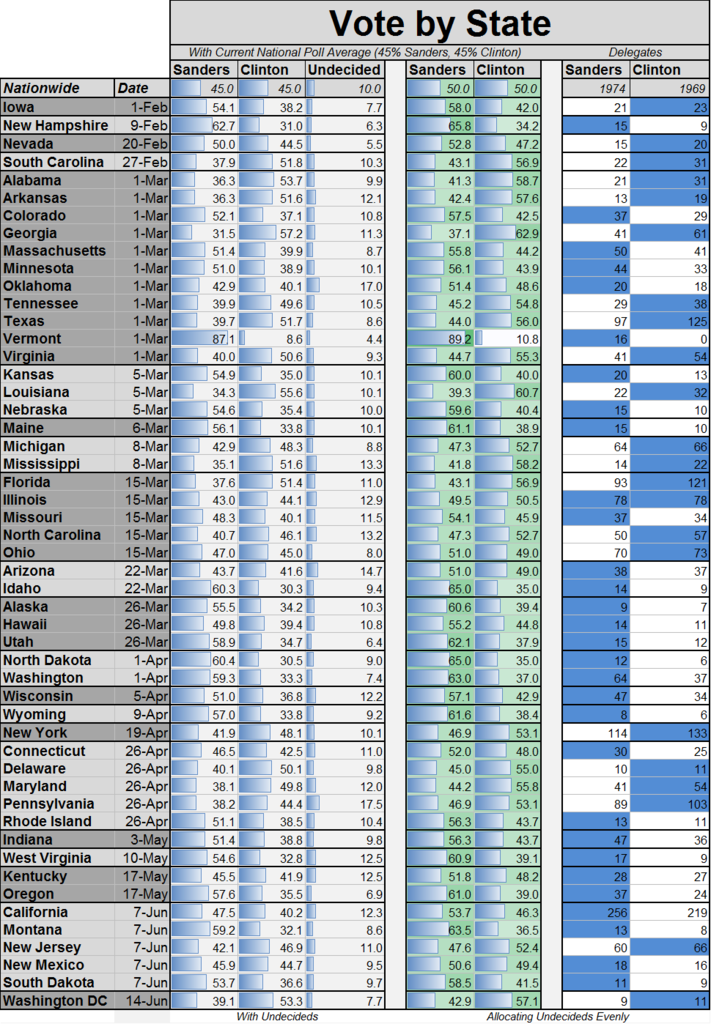 Delegates by state with a static 45-45 national tie
Next, the chart below shows how that works out when you aggregate states that vote on the same dates.
Even in the case of a static national tie (in which Sanders ultimately wins more delegates), you can see that Clinton would be expected to hold a delegate lead from March 1 until June 7. Notice, as we did in the Clinton lead (49-42) scenario, that March 15 is a turning point in the race. Notice also that in this scenario, Sanders does not need to win every last state outside of the south. He can some significant states like Michigan and Illinois which vote by March 15 (as long as he keeps them reasonably close), as well as losing other non-Southern states like New York, Pennsylvania, and New Jersey (Maryland/Delaware are technically border states) that vote later on in the calendar, and still be on course to win. While Sanders will need to win in most places outside of the south, he doesn't need to win everywhere outside of the South. Much depends on the margins, and how those margins translate into delegates.
Recall that under the Clinton lead scenario, Clinton would have won 84% of her final delegate margin by March 15. March 15 plays a similarly important role here. In the national tie scenario, March 15 would mark the maximum extent of Clinton’s national lead — it is the turning point after which better states for Sanders begin to vote, and after which he finally has an opportunity to eat away at the delegate lead that Clinton will almost certainly have accumulated by then.
This is why the Clinton campaign has been issuing memos arguing to the effect that the race will be decided by March 15 — because they know that Clinton will have a lead by that point, and would like it very much if nobody notices that at least an important part of the reason why that will be the case is that a disproportionate share of the delegates that will have been elected by that point will have come from the most demographically friendly states to Clinton. And because they know that as soon as March 16 rolls around, they will be facing a relentless onslaught of states, the overwhelming majority of which are much more likely to vote for Sanders.
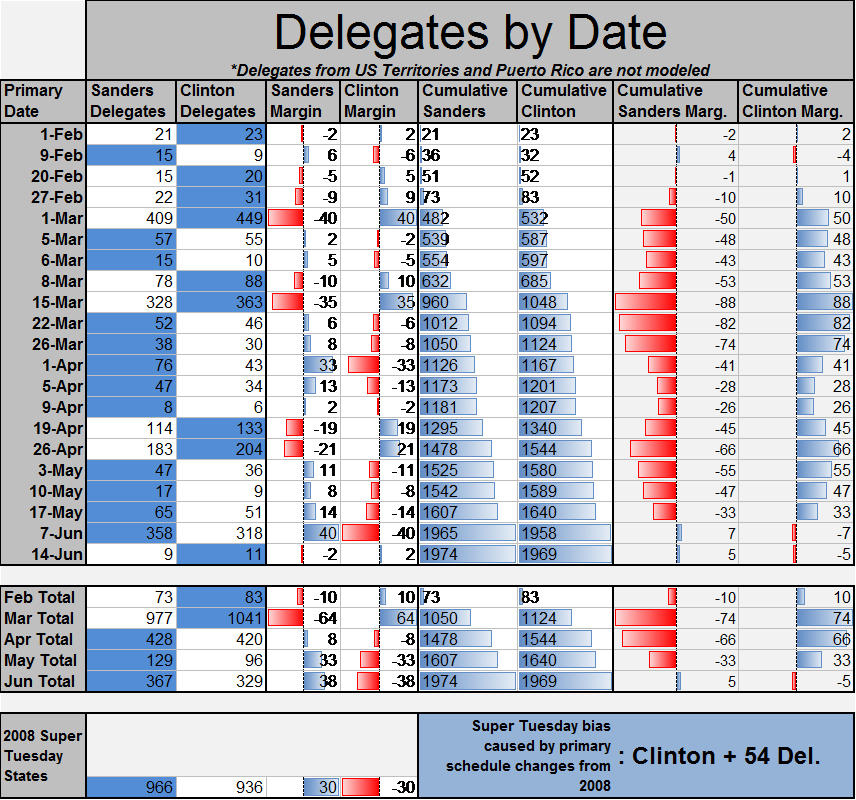 Delegates by date with a static 45-45 national tie
Under this scenario, Clinton would win by a margin of about 40 delegates on Super Tuesday (449 to 409). Even with a national tie, states that are favorable to Clinton would continue to vote through March 15, by which time she would be expected to lead by about 88 delegates (1048 to 960). After March 15, however, things change. By that time, all southern states would have already voted and states in which Sanders would be expected to do well in the Northeast, Midwest, and especially the West begin to vote. With substantial victories in states like Washington, Wisconsin, Alaska, and Idaho Sanders would be expected to gradually whittle down Clinton’s lead to about 26 delegates by April 9. Clinton could then stage a mini-comeback when finally New York and Maryland on April 19 and April 26 put a temporary pause to the Sanders avalanche, bringing Clinton's delegate lead back up to about 66. But after that, another string of states that should be relatively good for Sanders start voting again, including West Virginia, Indiana, Kentucky, and Oregon. Those states are enough to knock Clinton’s lead back down to 33 in this scenario. Finally, on June 7, California votes. With around a 7% win in California, combined with coming roughly even across the other states voting on June 7 (Montana, New Jersey, New Mexico, and South Dakota), Sanders would finally reverse Clinton’s lead and narrowly pull ahead (by about 7 delegates in this nailbiter scenario). Washington DC might then narrow that margin slightly on June 14. Of course, the delegates elected in the territories and Puerto Rico could also make a difference, but I am not attempting to model them due to lack of any basis on which to do so.
Hence in a static national tie, we should expect there to be 4 apparent “momentum changes.” First, Clinton dominance through March 15. Then a Sanders comeback until April 19. Then, a brief Clinton comeback until May 3, followed by another Sanders comeback to finally bring the delegate count back to somewhere around even. But this great drama would really just be a side effect of the way the primary calendar is structured.
This is what should be considered a baseline scenario – it is what the model predicts the race would look like if Clinton and Sanders stayed locked in a tie in the national polls throughout the entirety of the race from now on. Looking at the totals by month, Clinton would be expected to win a net margin of about 64 delegates in March, when the most favorable states for her vote, and then Sanders would be expected to reverse that with net margins of 8, 33, and 38 delegates out of the states that vote in April, May, and June, which are more demographically favorable for him.
Also look at the comparison between 2008 Super Tuesday states and 2016 Super Tuesday states, and you can see that in a tied national race, Sanders would be expected to lose the 2016 Super Tuesday states by a margin of about 40 delegates. But if the primary calendar were the same as in 2008, Sanders would be expected to win the 2008 Super Tuesday states by about 30 delegates – even better than Obama’s actual 13 delegate margin from 2008’s Super Tuesday.
The size of the bias towards Clinton in the projected Super Tuesday caused by changes in the calendar from 2008 to 2016 actually increases from +43 delegates for Clinton in the scenario where she leads nationally by 49-42 to a +54 delegate bias for Clinton in the scenario of a 45-45 tie. What does that mean?
It means that if Sanders manages to hold Clinton to a 41 delegate win in the 2016 Super Tuesday states, that would be a roughly equivalent feat to Obama’s actual 13 delegate Super Tuesday win in 2008, controlling for the change in which states are voting in 2016 as compared to 2008 (the calculation is that Obama's 2008 Super Tuesday margin equals the size of the bias minus Clinton’s 2016 Super Tuesday delegate margin : 13 = 54 - 41).
A hypothetical 47-44 Sanders National Lead
Next, what would a static scenario look like in which Sanders held a narrow but significant 3 point lead throughout? If Sanders does win, this is not how he is most likely to do it (since the race will be dynamic), but it is worth a look nonetheless:
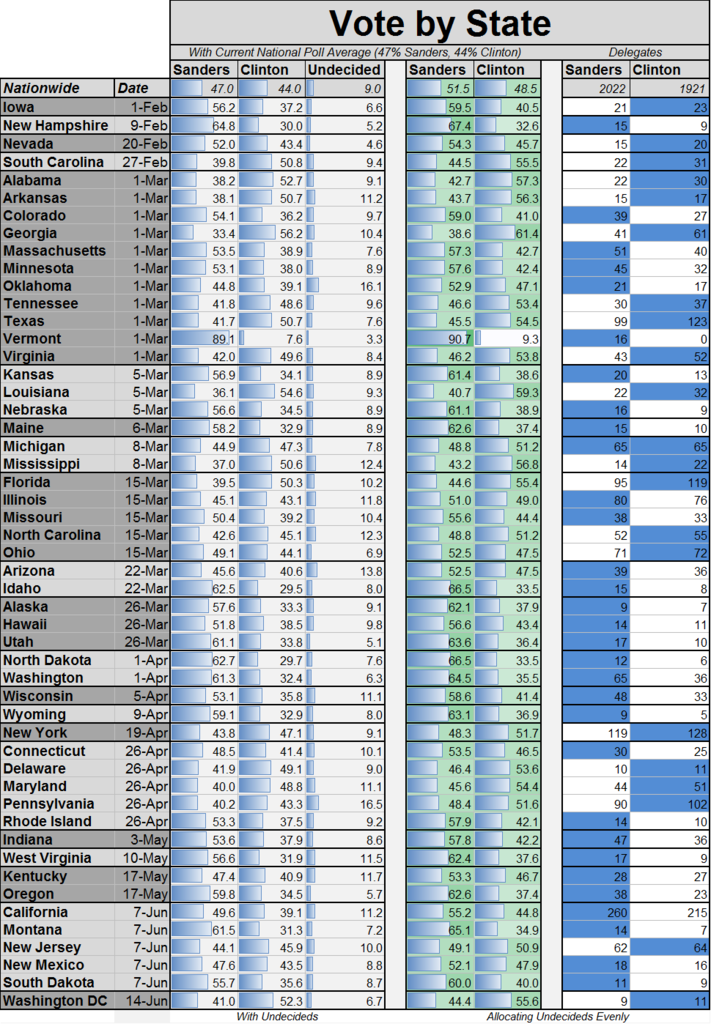 Delegates by state with a static 47-44 Sanders national lead
Even under this scenario, in which Sanders holds a solid national lead throughout, Clinton still wins more delegates on Super Tuesday and through March 15, simply because the states that will have voted by then are demographically tilted in her favor, compared to the country as a whole.
Even if Sanders were on course for a very solid national delegate margin (of about 111 delegates), Clinton would nonetheless be expected to be ahead by about 36 delegates on the morning of March 16:
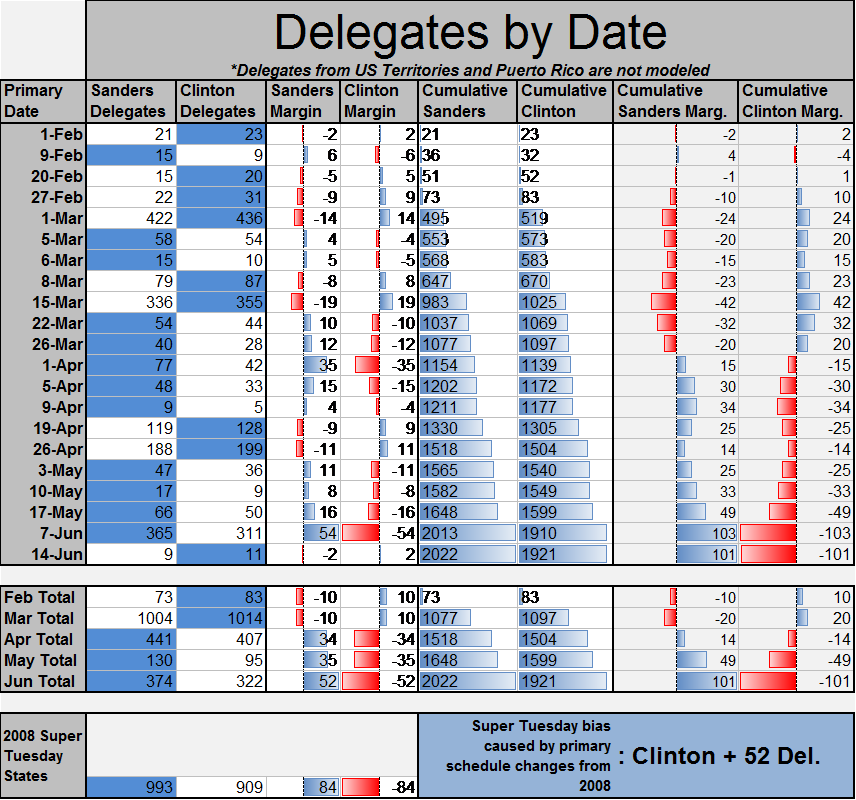 Delegates by date with a static 47-44 Sanders national lead
The bias here on Super Tuesday for Clinton remains about the same as before: +52 delegates “artificially” tacked on to her lead simply by the favorable demographics of the 2016 Super Tuesday states for her, in comparison to the 2008 Super Tuesday states.
So if you want to compare the 2008 Super Tuesday results to the 2016 Super Tuesday results on an even basis (taking into account the fact that the 2016 Super Tuesday is tilted much more towards Clinton's strongest region), a quick rule of thumb is that you can subtract somewhere between about 40 and 55 delegates from Clinton’s Super Tuesday margin.
A note on momentum in presidential primaries
Next, we will drop the assumption that the race remains static and consider what might happen if (more realistically), the national polls change as states are voting.
Clearly, the best case scenario for Clinton would be that she wins South Carolina, wins by a large margin in states and delegates on Super Tuesday, and then goes up in the polls while Sanders drops in the polls. This scenario is based upon the presumption that Clinton will benefit from “momentum.” It will also be facilitated and made more likely if the media doesn't understand, doesn't realize, and doesn't report on the nuance about the effects of the order in which states vote. While I certainly would not dismiss this scenario, it is worth thinking a bit more carefully about the concept of “momentum” in Presidential primaries and why it arises.
The cases in the past in which momentum clearly has mattered are the cases in which:
-
The candidates are generally less well known.
-
A multi-candidate field is being winnowed down, often with multiple candidates vying to get into second place and be the alternative to some front runner (e.g. “the Anti-Dean,” “the Anti-McCain,” “the Anti-Romney,” “the Anti-Trump”).
-
Primary voters are motivated by the desire to beat some specific opposition party incumbent (e.g. Democrats motivated to defeat Bush in 2004) and are looking to rally around a candidate and move on to the general election. This applies to cases in which an incumbent President is running for re-election.
Another general point to note about "momentum” is that public polls can easily exaggerate it. In the 2012 general election, public polls showed lots of fluctuations that the media interpreted as “momentum” for one candidate or the other. But in reality, the race remained pretty much steady for the vast majority of the time — and the supposed changes in “momentum” never showed up in the Obama campaign’s much better internal polling.
So let's consider how these factors apply to recent Presidential primaries.
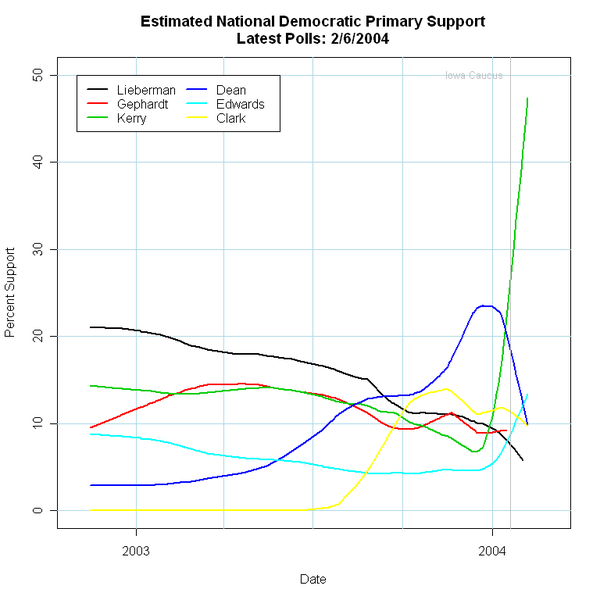
2004 Democratic Primary
Momentum played a tremendous role in the race. Out of a crowded field of about 10 candidates and about 5 more viable ones, John Kerry won Iowa, then New Hampshire, and there was no stopping him after that. In this case, all 3 of the factors above clearly applied. Kerry (and the other candidates) were not particularly well known, a large field was being winnowed down (with multiple candidates vying to be the “Anti-Dean”), and Democrats wanted to rally behind a suitably “electable” candidate who voted for the Iraq war and could therefore beat Bush (recall how that turned out):
2008 Republican Primary
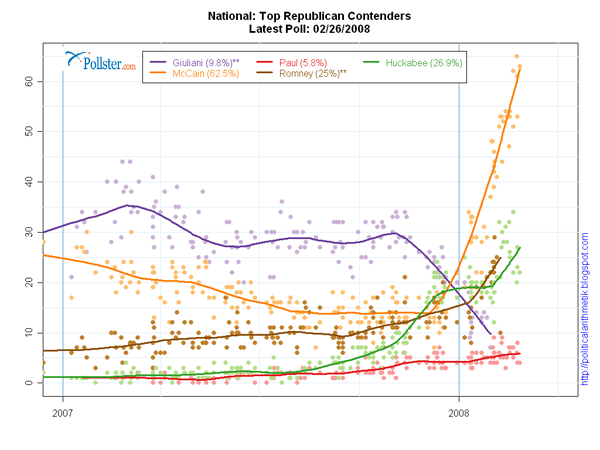
Again, we see the momentum dynamics of a multi-candidate field. Giuliani was nominally the "frontrunner” for a long time, but his lead had been based on name recognition. After Huckabee and then McCain won Iowa, New Hampshire, they gained support lost by other candidates who had become unviable (Fred Thompson is not shown on the chart). If the GOP had proportional delegate allocation rules (as do the Democrats), it is possible that it might have settled into a two-person race between either Romney or Huckabee and McCain. But as it was, McCain started winning winner-take-all contests, and so the others never had a chance. Note we are starting to see a similar multi-candidate dynamic in the 2016 GOP race — with Trump taking all the delegates in South Carolina (and most in Nevada) while Rubio and Cruz compete to be the "Anti-Trump.”
2012 Republican Primary
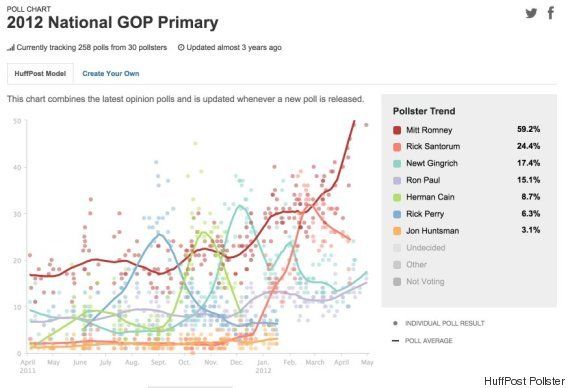
In another multi-candidate field, momentum again played an important role. Perry, Cain, Gingrich, and Santorum all had their moments. But they were all (with the exception of Gingrich) relatively unknown nationally, and they couldn’t stand up to the scrutiny of a national campaign. So then they collapsed and their support transferred to the next dwarf in line, who then also collapsed. In the end though, Santorum collapsed at least as much because of the winner-take-all delegate rules of the GOP primary as because of the inherent weaknesses of his candidacy. If the GOP delegate rules were consistently proportional like the Democrats, Santorum could have at least made it competitive for substantially longer, and perhaps even have overtaken Romney to win.
2016 Republican Primary
Clearly, momentum is playing an important role in the ongoing Republican race. Factor 1 has applied, especially to candidates like Carson and to a lesser extent Cruz and Rubio who have benefited from momentum. Factor 2 has clearly applied, with multiple candidates vying to be the “Anti-Trump.” Factor 3 may even apply somewhat, so visceral is the GOP's hatred of Obama.
2008 Democratic Primary
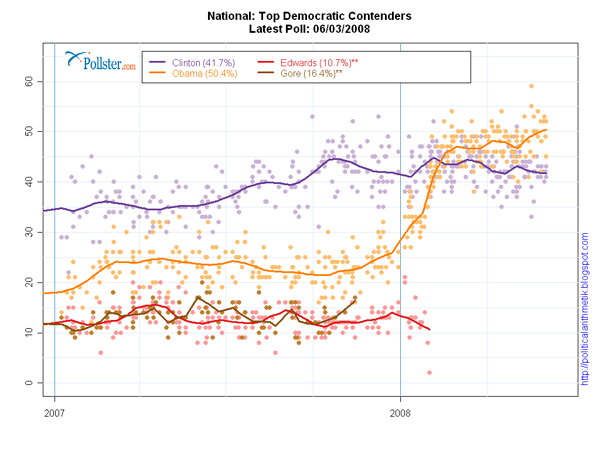
In the 2008 Democratic primary, momentum did play a role in the race. However, that role was mostly limited to the initial period of the race, in which there were multiple candidates. Barack Obama clearly benefited from momentum after Iowa, in particular from increased support from African Americans who realized that he had a shot. But Obama really shot up in the polls was after John Edwards and all of the other minor candidates dropped out of the race, leaving a two person contest between Obama and Clinton.
After that, momentum seems to have played a much smaller role in the race. Clinton and Obama went back and forth for months, each winning some states and losing others along predictable and fairly constant demographic lines. Throughout this, changes in the national polls were small for several months. And what changes there were in the polls were at least as attributable to campaign events like debates and the Reverend Wright buggaboo as to particular states that either candidate won or lost:
2016 Democratic Primary
Now compare and contrast all of those to the current Democratic primary:
It looks different from all of those. Insofar as it looks similar to any of them, it looks similar to 2008 (without Edwards and the other candidates). Rather than surges of momentum going back and forth, we see a very consistent, long-term, and persistent pattern — Sanders gradually picking up support at a rate that has been fairly consistent since he entered the race.
What is different is:
So the reason to think that Clinton may not benefit much from momentum is because the race bears some similarities to the 2008 Democratic primary — namely that it has already settled into a two person race, and that one of the candidates (Clinton) is already universally known, while the other (Sanders) is becoming more so every day.
So if Clinton suddenly benefits from the sort of momentum that John Kerry experienced in 2004 (and like in recent GOP primaries), the race will soon be over if she pulls ahead in delegates (as she will do even if Sanders ultimately wins) from Super Tuesday through mid-march.
But there is plenty of reason to doubt that is what will happen. If instead, the more stable dynamics of a contested two-person race with proportional delegate allocation set in (as in the 2008 Democratic primary), then "momentum" will play a much more limited role. In this case, we could easily be in for another long primary season — extending all the way to June 7.
Scenario 1:
The worst case scenario for Sanders in which he could still pull off a narrow win
So now let's game out how the dynamics of the Democratic race could play out if we do not assume that it is static (as in the static 49-42 Clinton, 45-45 tie, and 47-43 Sanders lead scenarios considered above).
I will assume that Clinton will not benefit from substantial momentum following wins in southern states, for the reasons described above — I am assuming that the dynamics of the 2016 race will be different from those of the multi-candidate races in which momentum has played a large role. While Clinton will obviously benefit from positive press following South Carolina and Super Tuesday, it is assumed that this won’t actually translate into a substantial reduction of Sanders’ support — similarly to the way in which in 2008, wins by Clinton and Obama did not translate into significant “momentum” leading the other candidate to drop precipitously in the polls.
So what is the worst conceivable scenario for Sanders in South Carolina, on Super Tuesday, and through Mid-March in which it would nonetheless be possible for him to eke out a narrow win? Something like this:
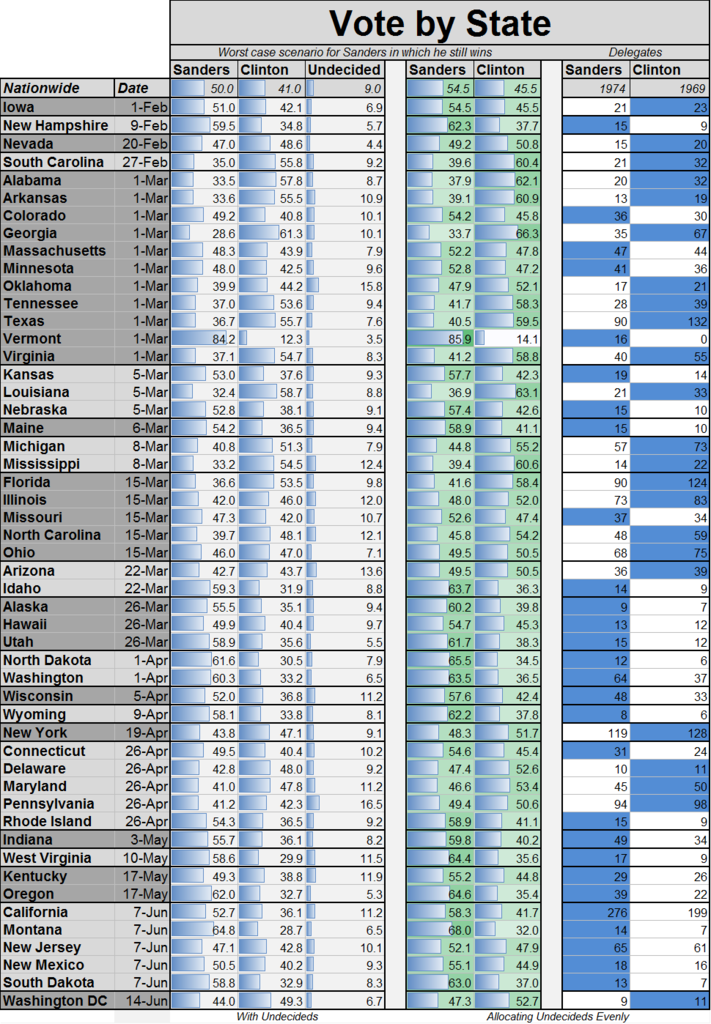
Under this scenario, the national polls change across time. Sanders gains no additional ground before Super Tuesday. However, he continues to slowly but surely gain ground nationally, as he has since he entered the race.
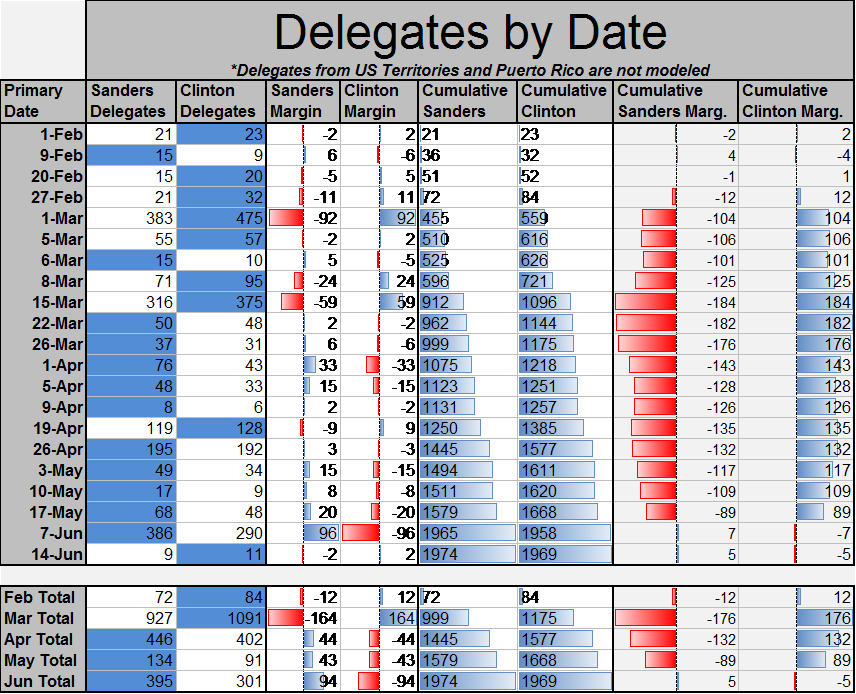
The chart below shows how that works out when you aggregate states that vote on the same dates:
South Carolina and Super Tuesday:
- Clinton holds a 49-42 national lead in the polls
- 104 delegate cumulative Clinton lead
Sanders gains no further ground before Super Tuesday. Clinton wins by a bit more than 20 points in South Carolina, and then does a pretty good job of cleaning up in the South on Super Tuesday, winning on Super Tuesday by 92 delegates (as currently projected). Although Sanders does still win all four non-Southern states, he does so with comparatively narrow margins. Clinton also holds Sanders below some crucial delegate allocation thresholds in a number of Congressional districts in Georgia and State Senate districts in Texas in particular, and Clinton also wins Oklahoma by 4%.
This all adds up to a pretty good Super Tuesday for Clinton and a pretty bad one for Sanders. Could he come back from this sort of setback? In theory, yes. But only with great difficulty and by the skin of his teeth.
March 5:
- Clinton holds a 48-43 national lead in the polls
- 106 delegate cumulative Clinton lead
However, right after Super Tuesday, some good things start happening for Sanders. A handful of more favorable states for Sanders begin voting — Kansas and Nebraska on March 5, and then Maine on March 6. Sanders pulls off reasonable victories in all three of these states, thus demonstrating that he is still in the race after Super Tuesday (but Clinton gains delegates thanks to a blowout in Louisiana).
If you are wondering why Bernie Sanders was in Kansas City yesterday, this is why. If you are wondering why he has 3 field offices in Kansas, this is why. If you are wondering why he has 2 field offices in Nebraska, this is why. And if you are wondering why he has 4 field offices in Maine, this is why. Because he is already planning for the race beyond Super Tuesday, and because he has his eyes set on victories in Kansas, Nebraska, and Maine shortly after Super Tuesday.
March 15:
- Clinton holds a 47-44 national lead in the polls
- 184 delegate cumulative Clinton lead
Sanders continues, gradually, to pick up support, but good states for Clinton keep coming up on the calendar to help expand her delegate lead. Sanders knows he is fighting an uphill battle, but that better states for him will soon start voting. Clinton wins Michigan by 10, and has won Louisiana and Mississippi in landslides. On March 15, Sanders only wins Missouri, though he holds Clinton to a narrow 1 point win in Ohio and to a 4 point win in Illinois. Florida and North Carolina go to Clinton by 17% and 8% margins. Clinton's delegate lead continues to mount.
March 26:
- Clinton holds a 46-45 national lead in the polls
- 176 delegate cumulative Clinton lead
The time is now or never for Sanders. Finally, the entirety of the South has finished voting, and only states in the Northeast, Midwest, and West remain on the schedule. Only a few relatively good states for Clinton like New York, New Jersey, and Pennsylvania are left — everything else should be winnable for Sanders, or else should favor him. Sanders is down by what may seem like an insurmountable margin: 200 delegates. He needs to start coming back ASAP, or it is game over.
He starts to do so on March 22, by keeping it close in Arizona and winning in Idaho. Then he sweeps Alaska, Hawaii, and Utah on March 26.
April 1:
- Sanders holds a 46-45 national lead in the polls
- 143 delegate cumulative Clinton lead
Slowly but surely, Sanders continues to gain a bit more ground in the national polls. He finally pulls narrowly ahead (which he obviously needs to do eventually in order to win). On April 1, he wins a delegate-rich blowout in the Washington State caucuses, and also wins handily in North Dakota.
April 19:
- Sanders holds a 47-44 national lead in the polls
- 135 delegate cumulative Clinton lead
Clinton hopes that she can finally put an end to this with a win in New York, followed by good performances on April 26. She does gain some delegates from New York, but not many.
April 26
- Sanders holds a 48-43 national lead in the polls
- 132 delegate cumulative Clinton lead
Sanders keeps gradually picking up support, and it's enough that he picks up a few delegates even though Clinton wins Delaware, Maryland, and Pennsylvania.
May 3:
- Sanders holds a 49-42 national lead in the polls
- 117 delegate cumulative Clinton lead
Another better string of states for Sanders starts with Indiana, which he wins handily. West Virginia is up next.
May 10:
- Sanders holds a 50-41 national lead in the polls
- 109 delegate cumulative Clinton lead
West Virginia is less of a blowout for Sanders as it was for Clinton in 2008, but still a pretty big blowout.
June 7:
- Sanders holds a 51-40 national lead in the polls
- 7 delegate cumulative Sanders lead
Kentucky and Oregon vote strongly for Sanders. And then finally it is California’s turn (as well as Montana, New Jersey, New Mexico, and South Dakota). Combined, they have enough delegates for Sanders to finally pull ever so narrowly ahead.
Through the Convention
Now it’s in the hands of the Superdelegates. They can either ratify the choice of the voters, or they can overturn it and nominate Clinton anyway, amidst cries that they are violating the principles of Democracy and are stealing the election like the Supreme Court did in 2000.
There’s an important point to note about this scenario — in any scenario in which Sanders has a narrow pledged delegate lead, he will also very likely have a clear lead in national primary polls, and thus be the current choice even of a good number of people who had previously voted for Clinton when their states originally voted earlier in the calendar. The reason for that is that Clinton is likely to win early (through March 15), and in order for Sanders to win, he will have to come back after that. Mathematically speaking, to do so he will almost certainly have to pull into a national lead of at least some magnitude by the time California and the other June 7 states vote. So under any plausible scenario in which superdelegates might overturn the pledged delegates, they would almost certainly be going against the choice of most voters as expressed in national primary polls. At least to me, that makes it even less plausible to think that superdelegates would even contemplate such a thing than it already is.
Scenario 2a:
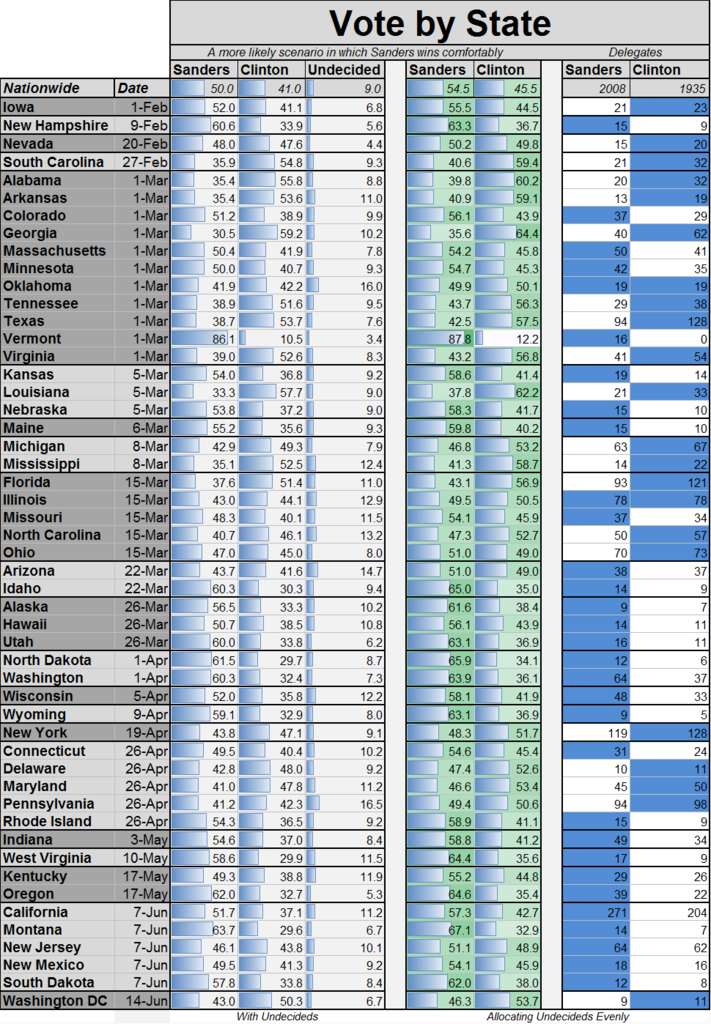
The scenario above stretches plausibility. While it is indeed mathematically possible for Sanders to come back after being behind by around 200 delegates on March 15, that is on the outer limits of the sort of comeback that is achievable. What about a scenario in which Sanders manages to do at least a bit better than the model is currently projecting on Super Tuesday through March 15? This is the sort of scenario that is probably most likely if Sanders does end up winning the nomination.
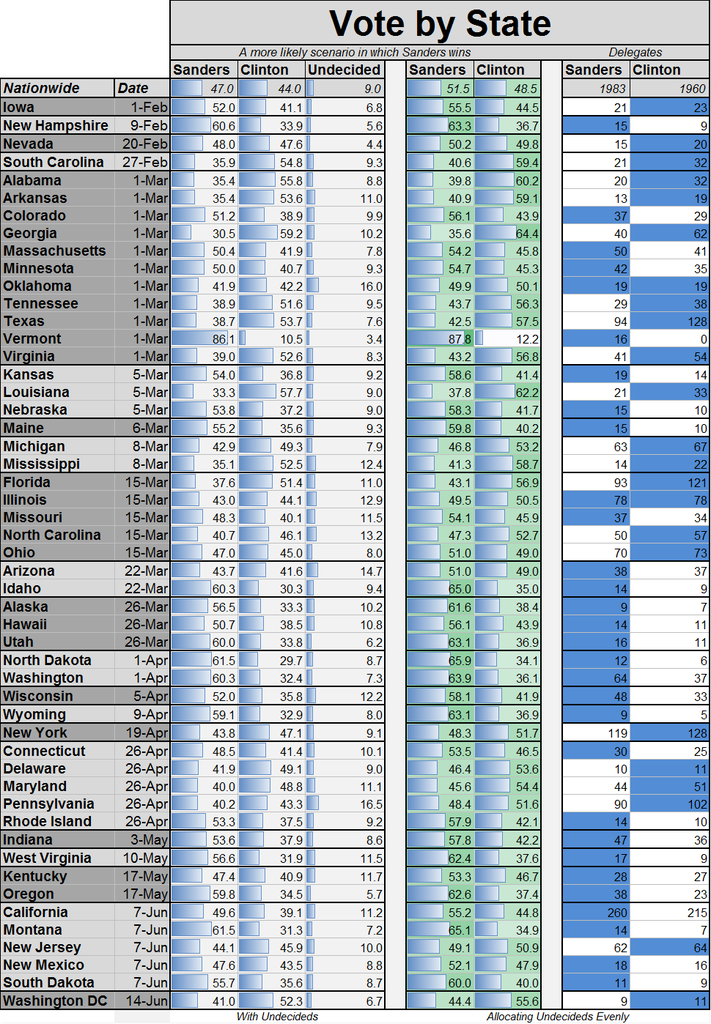
A more likely scenario for a narrow Sanders win
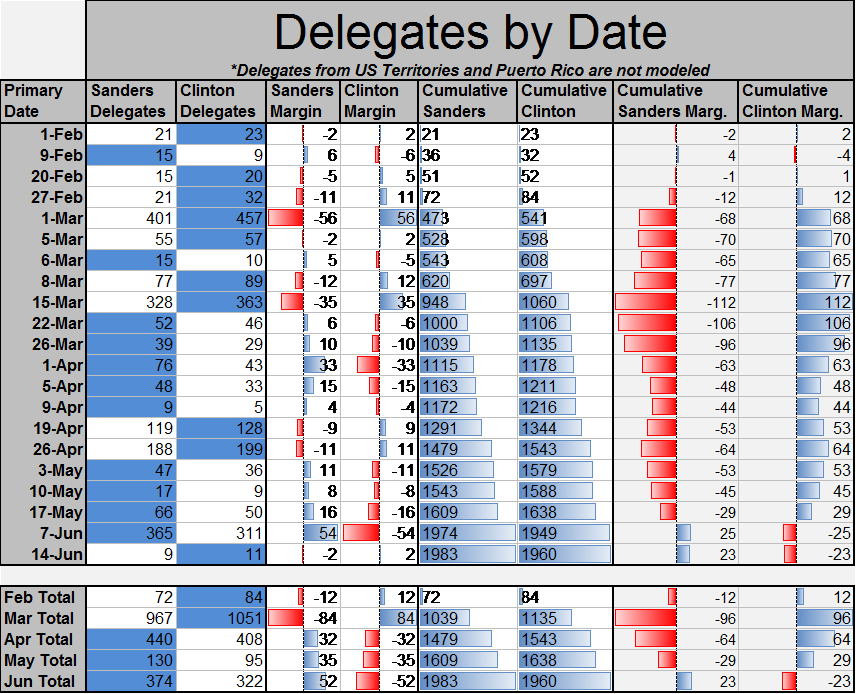
South Carolina (Feb 27):
- Clinton holds a 48-43 national lead in the polls
- 12 delegate cumulative Clinton lead
Sanders gradually continues to pick up support, and he manages to do better in South Carolina than some of the recent polls have indicated. He holds Clinton just under a 20 point win in South Carolina. The delegates split 32-21 to Clinton.
Super Tuesday (March 1):
- Clinton holds a 47-44 national lead in the polls
- 68 delegate cumulative Clinton lead
Sanders gains a tiny bit of further ground by Super Tuesday. Or alternatively, you can think of it as him doing somewhat better than many polls indicate on Super Tuesday. In any case, Clinton ends up winning on Super Tuesday by only 56 delegates. If you recall the rule of thumb of subtracting about 40 to 55 delegates from Clinton’s lead to control for the effects of the Super Tuesday states being disproportionately concentrated in the South, this is not such a bad result for Sanders at all. It is certainly one that he can come back from, provided that he continues to gain support.
In Oklahoma, there's another one of those virtual ties. Clinton narrowly wins statewide 50.1% to 49.9%, but Sanders wins in the Congressional districts that he needs to win in, so the delegates come out as a tie from Oklahoma. Sanders manages to do just well enough to avoid some of those nasty delegate cutoffs in certain Georgia congressional districts and Texas State Senate districts. But although Sanders wins in the northern states, he doesn't get the sort of blowout 60-40 caucus wins in Colorado and Minnesota that he ideally would like. So it could have been better for Sanders, but it also could have been worse. As for Clinton, she certainly extracts delegate leads from the South, but she would have preferred to extract a larger delegate lead that could have made it more difficult for Sanders to come back.
March 8:
- Clinton holds a 46-45 national lead in the polls
- 77 delegate cumulative Clinton lead
After Super Tuesday, the race shifts briefly to a few more favorable states for Sanders. He wins in Kansas, Nebraska, and Maine by 15-20% in each, although Clinton wins handily in Louisiana. With Sanders showing that he is still alive and kicking after Super Tuesday, people start to really realize that this thing could actually drag on for a while. Sanders gains additional ground — we see a few more of those "outlier” polls showing Sanders with a national lead. Still, Clinton’s delegate lead expands a bit more as more southern states vote.
March 15:
- A 45-45 national tie
- 112 delegate cumulative Clinton lead
Sanders pulls barely into a national tie with Clinton. On March 15, Sanders wins Missouri and Ohio, and comes within 1 point in Illinois. But because of the oddities of delegate allocation rules, although Sanders wins Ohio by 2%, Clinton ends up with 3 more delegates (that is because almost all of Ohio's congressional districts have 4 delegates, while the heavily Democratic and African American districts are given abnormally large allotments as compared to in other states). Meanwhile, although Sanders loses the popular vote in Illinois, the delegates work out as a tie. So it is a bit muddled as to who has really “won” what.
Clinton wins the last two southern states to vote - Florida and North Carolina. With that, the race will move entirely into the Northeast, Midwest, and West.
March 26:
- Sanders holds a 46-44 national lead in the polls
- 96 delegate cumulative Clinton lead
As the race shifts to friendlier states for Sanders, he pulls into a narrow national lead. Sanders narrowly wins Arizona, with an assist from Raul Grijalva, and Idaho is a 30 point landslide for Sanders. Alaska, Hawaii, and Utah are not a bad trio for Sanders on the 26th. Clinton’s delegate lead begins to decline. By this time, it is clear that it is going to be a long few weeks for Clinton until New York votes.
April 9:
- Sanders holds a 47-44 national lead in the polls
- 44 delegate cumulative Clinton lead
North Dakota and Washington are another two good states for Sanders. 30 point landslides in each. By the time Wisconsin votes, Sanders is up by 3 nationally.
Through the convention
All Sanders has to do now is hold a 47-44 lead. That is enough to end up ahead. Of course, if he continued to gain ground in the polls, he could expand his delegate lead further. But it is enough to stay at 47-44 and come out with a 23 delegate win.
Scenario 2b:
Continuing the previous scenario, how many delegates could Sanders gain from some slight additional gains in the polls?
In which Sanders continues to build a bit larger of a lead from scenario 2a
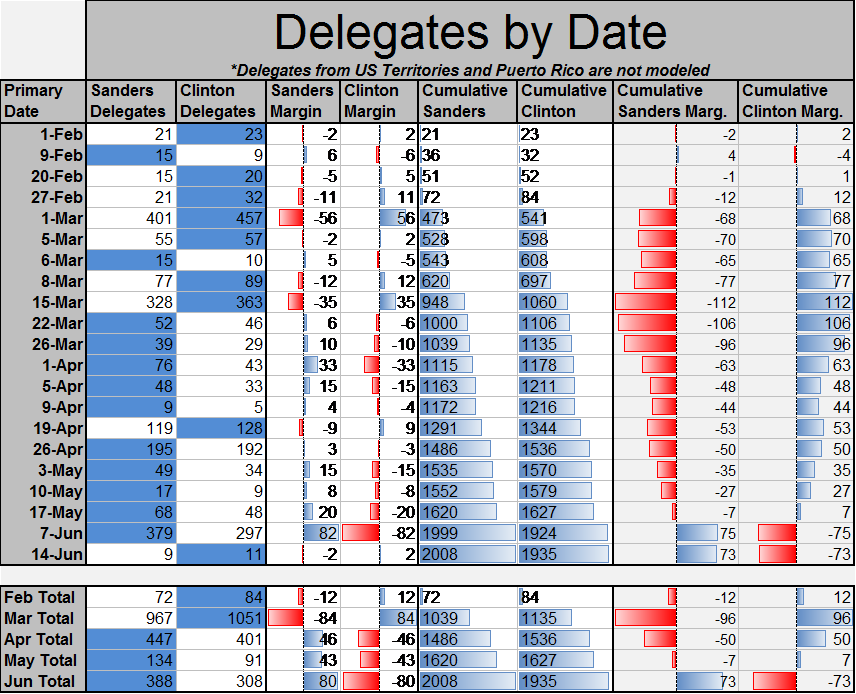
April 26:
- Sanders holds a 48-43 national lead in the polls
- 50 delegate cumulative Clinton lead
New York, Maryland, and a few other states that are relatively better for Clinton vote. This lets Clinton stage a small comeback, as in previous scenarios. But down 5 in the national polls, it doesn't net her very many additional delegates.
May 10:
- Sanders holds a 49-42 national lead in the polls
- 27 delegate cumulative Clinton lead
New York, Maryland, and a few other states that are relatively better for Clinton vote. This lets Clinton stage a small comeback, as in previous scenarios. But down 5 in the national polls, it doesn't net her very many additional delegates.
June 7:
- Sanders holds a 50-41 national lead in the polls
- 75 delegate cumulative Sanders lead
Sanders keeps gradually gaining support. By June 7, he is ahead by enough so that he can pull ahead comfortably with wins in California
Conclusion
I’m not saying that these scenarios describe what will happen. Like I said at the beginning, Clinton remains the frontrunner, and Sanders is the underdog. I'm saying it's what could happen. I’m saying that this is more or less the way that Sanders will win, if he wins. It is his path to victory in any potential long primary marathon.
A few points are notable and worth reiterating:
- The primary calendar is tilted in such a way that even if Sanders wins, Clinton will pull ahead in the pledged delegate count after March 1 and March 15 — perhaps by a lot.
-
On Super Tuesday alone, the shift in the states that are voting as compared to the states that voted in 2008’s Super Tuesday is enough to "artificially” expand Clinton's delegate margin by about 40 to 55 delegates. Of course, that is just a temporary effect, but it will make it appear that Clinton is doing better than she actually is. Similar sorts of biases apply to the rest of the calendar through March 15 (though I haven’t bothered to try and quantify it).
-
Sanders can win even without winning any states in the South at all. He also can afford to do without at least some states in the North, Midwest and West (including some big ones, like Michigan, Illinois, Pennsylvania, and New York). Of course, the margins do matter. While he doesn’t need to win all such states, he does need to win some, and he needs for Clinton not to win blowouts in those sorts of states.
-
The intricacies of delegate allocation thresholds matter, and not just the pure popular vote. In any close race, we’ll probably see some more weird delegate allocation situations such as Sanders winning Ohio but Clinton winning more delegates.
- In order for Sanders to win, it probably has to be the case that the concept of “momentum” doesn't apply (or at least does not apply very strongly) to a two person race, as opposed to in a multi-candidate race like the 2004 Democratic primary or the last few GOP primaries. The dynamics have to be similar to 2008. But there are some reasons to believe that this may be what happens.
-
In any scenario in which Sanders wins, he probably won't pull ahead in delegates until June 7. Under that scenario, California will decide the nomination.
-
In any scenario in which Sanders wins, he will almost certainly hold a reasonably sized lead in the national polls (i.e., probably at least 3 points). That is because Sanders will have to be leading nationally in order to come back at the end of the calendar. That means that it is probably substantially less likely than commonly thought that superdelegates would be willing to give the nomination to Clinton if Sanders wins the most delegates — because to do so they would have to blatantly override the majority preference of the people (at the time of the convention, as opposed to at the time in which the earlier states voted).
This is a continuing part of an ongoing series using polling data, past exit poll data, census data, and other data sources to analyze the 2016 Democratic Primary.
Previous posts are:
- Poll Meta-Analysis: The Bernie and Hillary 2016 Coalitions, and how they compare to 2008 Obama/HRC
- Poll Data Analysis: The Current State of the Democratic Primary
- How the delegate math shakes out for Bernie and Hillary down to the Congressional District level
- Bernie Sanders Did Much Better With Non-Whites In Iowa Than You Think
- Democratic Primary Model, Feb 8 Update (Pre-NH)
- Democratic Primary Model, Feb 9 Update (Pre-NH)
- Democratic Primary Polls for All 50 States
- Nevada Caucuses Preview and Democratic Primary Model Projections
- Why is Bernie putting resources into northern, not southern states? Cuz it's smart delegate strategy
For more detail on how delegates are allocated across different states, check out this excellent resource from Torilahure.


