I recently needed to know US voter turnout rates verses age for an analysis I did of Wisconsin Governor Jim Doyle's popularity. A quick web search turned up answers that were all over the map, with few people citing their sources or giving historical information. So I decided to do the research myself and this is the result:
Keep going for more info and a little discussion...
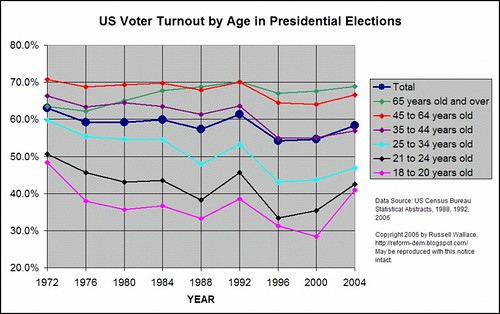
The chart above uses information from the US Census Bureau as published in its Statistical Abstracts for 1988, 1992, and 2006. A couple of things are obvious from the data. While overall voter turnout started trending upward in 2000, young voters have increased their turnout more than any other group; by nearly 50% for 18-20 year olds. Despite this, the older you are the more likely you are to vote, and this is a very strong effect. The 65+ crowd is still 1.6 times more likely to vote than those 24 or under.
There's more on my blog (scroll down a few posts), including a larger and expanded version of the chart above, and another nifty table that shows population and percentage vote by age group, which I think I'll explore further in the future because it has some pretty profound policy implications.
Someone asked me why I needed voter turnout verses age to do an analysis of a governor's popularity. The answer is that the Survey USA tracking polls I was looking at cover all adults, but what I really wanted to know was Governor Doyle's popularity among likely voters.
When I looked at the SUSA cross-tabs (cross tabulations, which are the combined results from two or more questions on a poll), one thing jumped out at me. Doyle is much more popular among older people, 54% for those older than fifty-four, than among younger people, where he's at 38% for those 34 and younger. So if I knew how likely each age group was to vote I could roughly estimate Doyle's popularity with voters (yeah, I know this involves a lot of other assumptions, but that's not worth going into here). Anyway, it turns out to be ... about one percent higher than the raw SUSA number. Not exactly a big deal, but of course I didn't know that until after I did my research and pushed through all the math. Sigh...
Caveats: While the Statical Abstracts are great information sources, you have to keep in mind that they are the result of surveys, and have the same flaws as all surveys. For example, the 2006 Statistical Abstract reports a 4% larger voter turnout in 2004 than there actually was. Also, I ran into obvious typographical errors in the Statistical Abstracts when I was doing my research, so it's wise to cross check data whenever possible.
