So, I've been a fair amount of work on how to weight polls from different pollsters and from different periods of time. It beats what I consider to the the depressing tenor of the Democratic campaign in recent days, and it's part of a project I'm working on to build some prediction models for the general election, which I hope will turn into an off-site project with frequent updates to Daily Kos. You ever wanted a version of the RCP averages that is smart enough to weight a Survey USA poll more than an ARG poll? That's what I'm going to try and do.
In any event, Survey USA has been publishing pollster report cards that assess the average error between different pollsters in all the primary races to date. I have one significant critique of Survey USA's methodology, which is that they tend to treat all primaries as being equal. For example, there are a lot of primaries (and caucuses) where all the pollsters missed big: South Carolina and New Hampshire are two prominent examples. And, as it so happened, Survey USA tended to sit out some of the races -- like New Hampshire, and Wisconsin -- that other pollsters missed badly. So, I want to do a version of analysis that builds in an adjustment for "degree of difficulty".
But first, let's do a version of what Survey USA did, and simply look at the average error for each of a wide group of polling firms. I tracked a total of 17 different polling firms; this should include all the usual suspects and then some:
American Research Group (ARG)
CNN / Opinion Research
FOX / Opinion Dynamics
Gallup
Insider Advantage
LAT / Bloomberg
Marist
Mason-Dixon
Public Policy Poling (PPP)
Quinnipiac
Rasmussen
Research 2000
Selzer & Co
Strategic Vision
Suffolk
Survey USA
Zogby
A couple of other important notes: I only looked at races in which at least three pollsters from the above group surveyed the election within 10 days of the primary or caucus. This includes AL, CA, CT, FL, GA, IA, IL, MA (Dem only), MD, MI (GOP only), MO, NH, NJ, NV, NY, SC, TN, VA and WI. As I intimated, I only included a firm if its poll was released within 10 days of that state's election. Also, one other matter of definition: I have simplified each race to a two-candidate affair. For the Democrats, this is straightforward: I evaluate the Clinton-Obama margin. For the Republicans, however, it depends on which two Republicans were most competitive in that race. This is McCain-Romney in CA, CT, FL, IL, MI, NV, NH, NJ, and NY. It is McCain-Huckabee in AL, GA, MD, MO, SC, TN, VA and WI. And it is Huckabee-Romney in Iowa.
Here are those results:
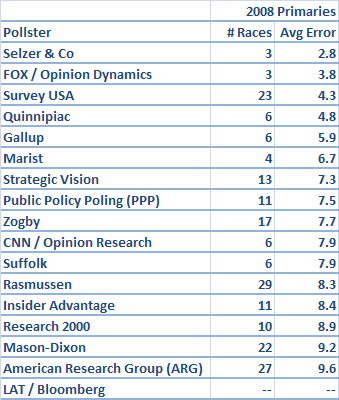
In general, my results should be pretty similar to Survey USA's. Survey USA really has done quite well.
However, are the same pollsters that have done well in this year's primaries -- like Survey USA -- also those that have done well in other recent elections? Next, let's take a look at the average error for general election states in 2004. I included 26 states, (I won't bother to list them) that at least three pollsters from our group surveyed within 15 days of the general election date, plus each pollster's final national number (I allow a slightly wider time frame because general election numbers tend to be much more stable than primary election numbers).
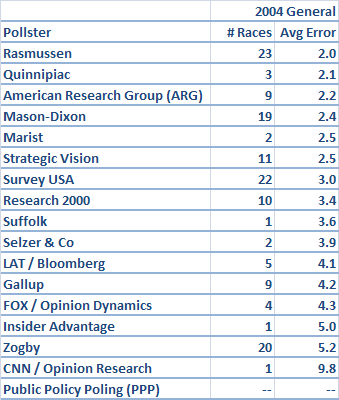
The first thing that jumps out is how much lower these numbers are across the board. Surveying the general election is degrees of magnitude easier than surveying the primaries, because there are many fewer swing voters, and because turnout is far more stable from election to election (although, I suspect this year's general will have both more swing voters and less predictable turnout than the last couple of elections).
But -- the pollsters that have done well in the primaries this year are not necessarily the same ones who did well in 2004. Rasmussen and Mason-Dixon, who have had fairly rough primary cycles, both did pretty well in the general election. ARG did pretty well in the general election, for that matter. Survey USA's results, on the other hand, were pretty marginal.
It may be that the pollsters who have had trouble in the primaries are exactly those who try and apply conservative, general election type turnout assumptions to the primaries. More likely, however, there is simply a lot of luck involved, which is why it helps to look at as much data as possible. In that spirit, let's look at battleground races for Senate (2006 and 2004) and Governor, as defined by Real Clear Politics. There are a total of 33 contests that qualified.
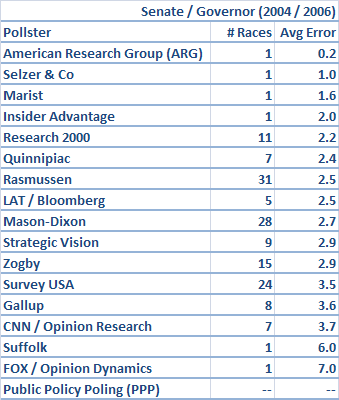
This time, it's Research 2000 that comes out looking good, though Rasmussen and to a lesser extent Mason-Dixon again did fairly well for themselves. Survey USA was among the lesser pollsters among those that surveyed a sufficient number of races.
Anyway, it's clear that we need a little bit of a finer-toothed comb to pick through these results and sort everything out. So, what I've done below is to compare the error for each pollster to the average error of all pollsters in that election. Why is this important?
Well, for example, PPP would at first glance look to have done badly in South Carolina. They predicted Obama to win by 20 points, when he actually won by 29 -- so they missed by 9 points. But the average pollster apart from PPP missed South Carolina by an average of 18 points. PPP actually deserves some credit for getting the race relatively close.
So, the next version of this analysis compares each pollster's average error to the average error of all pollsters in the contests that it surveyed -- in effect, that degree of difficulty adjustment that I described above. Note that I am weighting these numbers by the number of pollsters that surveyed a given contest. This is for a couple of reasons. Firstly, we have more points of comparison for states and contests that were surveyed by more agencies. It's one thing to get a race right when two other firms get it wrong, and another thing to get it right when ten other firms get it wrong. And secondly, since the more "important" races tend to get surveyed more often, this has the effect of placing more emphasis on higher-profile races.
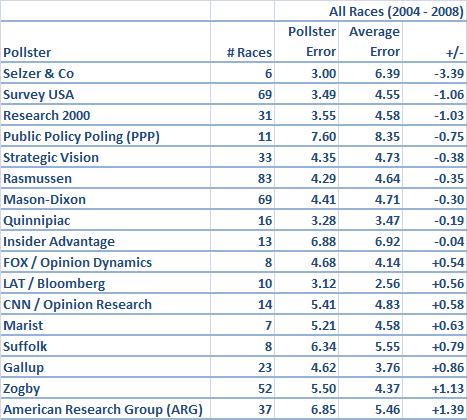
The results shift around a bit when we account for this degree of difficulty factor. PPP benefits a bit, for instance, as I suggested above. In contrast, a pollster like Quinnipiac, which tends to stick to "safe" races in big states, looks like an average pollster rather than a good one.
However, there is yet one last wrinkle I want to include. Different pollsters tend to survey different races. Some poll primaries heavily, but not the general election. Some will survey a lot of contests, while others are more regionally-based, or tend only to make cameos from time to time. What if a pollster looks good by comparison because it happens to be matched up frequently against ARG or Zogby? Or, it looks bad because it often has to battle Survey USA? The way I did this was to iterate the results several times, in much the same way that strength-of-schedule adjustments are calculated for the NFL or college basketball. Although this extra degree of detail does not make all that much difference, I've shaded the resultant table in yellow to highlight the fact that this is the "official" version of my pollster ratings:

We see Insider Advantage move down a bit -- it does seem to be matched up against ARG fairly often -- but otherwise the results are fairly stable.
For the most part, the winners and losers should be fairly self-evident. Selzer polls very much live up to their stellar reputation -- they're a real outlier in the positive direction -- although, with just 6 polls in the database, we probably shouldn't make too much of this result. Survey USA really is pretty good; it's awesome performance in the primaries is enough for it to end up way on the positive side, even after accounting for its marginal performance in general election matchups. Research 2000 also ends up looking good, which is one I wouldn't have guessed; they do pick-and-choose their races a little bit, but their results have been solid.
Rasmussen and Mason-Dixon are two pollsters that survey a ton of races and perform just slightly better than average. I'd be a little skeptical of any remaining primary polls they conduct, which tend to be based on overconservative turnout models, but for the general election they should be pretty solid. The new kid on the block, PPP, has done comparatively pretty well so far, although with just 11 contests under its belt, it's too early to come to any conclusions. And Quinnipiac and (surprisingly?) Strategic Vision seem to be just fine.
The biggest losers, predictably, are ARG and Zogby; note that I haven't included the Zogby Interactive polls, in which case they'd do even worse. Zogby hasn't actually been all that terrible in the primaries -- they'd actually rate as slightly above average in the primaries alone if you throw out their big mistake in the California Democratic primary -- but their long history of poor performance warrants plenty of skepticism. ARG, on the other hand, just seems to be getting worse and worse; their numbers have been off-the-charts bad in the primary cycle thus far.
Insider Advantage have been below average, but not completely terrible. Suffolk and Marist don't tend to survey many races, and when they do, they aren't much help. But, the other big group of losers are those polls associated with major news organizations. LAT (via Bloomberg), CNN (via Opinion Research) and FOX (via Opinion Dynamics) have all underperformed. So has Gallup, which had some bad misses (like Kerry taking Ohio and Florida by comfortable margins) in 2004.
How much difference does this all make? For a good pollster like Survey USA, which comes an average of 1 point closer than an average pollster, this is the equivalent of having a margin of error that is 1.25 points lesser. And for a bad pollster like ARG, which performs about 1.25 points worse than average, this is the equivalent of having an extra 1.56 points appended to its margin of error. The way this works out, ARG would have to have a sample size of about 1200 people to be equivalent to a Survey USA poll that samples just 300 people. In that sense, the very best pollsters really might be several times more reliable than the very worst ones.
