When I publish my graphs about the presidential race, some people ask for predictions. So, with just under a month to go, here they are, right below the fold.
I base my predictions on several things:
Pollster's predictions (shown below, with change from a week ago); Nate Silver's simulations on fivethirtyeight (also shown below, with change); my own graphs; and, in addition youth vote, Black vote, cell phone effect, and my guess at the Bradley effect (probably minimal).
The easy to predict states:
McCain - 19 states with 143 electoral votes (GA no longer easy)
State EV
Alabama 9
Alaska 3
Arizona 10
Arkansas 6 (maybe not so easy, see comments)
Idaho 4
Kansas 6
Kentucky 8
Louisiana 9
Mississippi 6
Montana 3 (maybe not so easy, see comments)
Nebraska 5 (4 out of 5, anyway)
North Dakota 3 (maybe not so easy, see comments)
Oklahoma 7
South Carolina 8
South Dakota 3
Tennessee 11
Texas 34
Utah 5
Wyoming 3
Obama - 15 states plus DC, 197 EV
California 55
Connecticut 7
DC 3
Delaware 3
Hawaii 4
Illinois 21
Iowa 7
Maine 4
Maryland 10
Massachusetts 12
New Jersey 15
New York 31
Oregon 7
Rhode Island 4
Vermont 3
Washington 11
Now, the hard stuff -- 15 States with 184; here I give details on each state.
Colorado 9 EV
Pollster Obama + 5.7 (down 0.5)
538 90% Obama (up 5)
Black proportion of voting age population 2.9
Youth proportion of voting age population 13
My graph
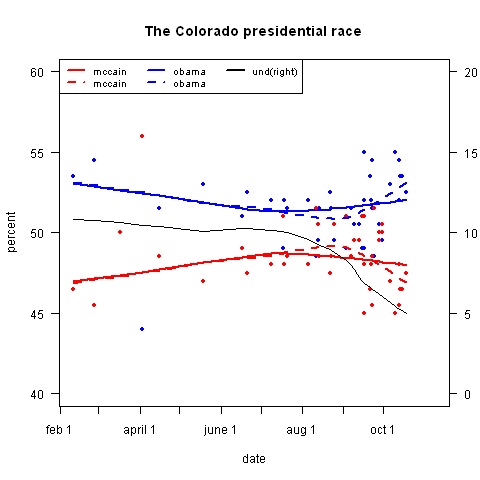 My prediction in CO: Obama by 7 points
Florida 27 EV
Pollster Obama + 4.2 (up 8.2)
538 75% Obama (up 5)
Black proportion of population 12
My graph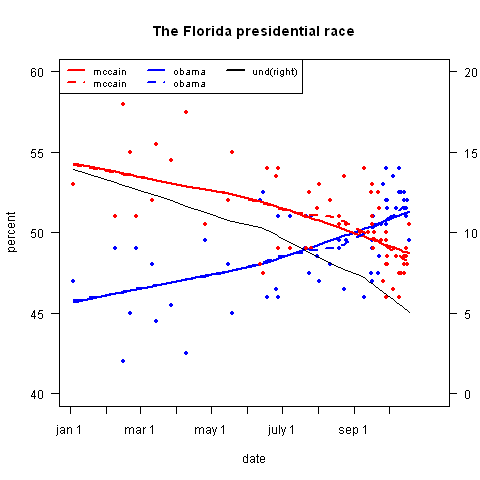
My prediction Obama by 5
Georgia 15 EV
Pollster McCain + 5.4 (N/A)
538 7% Obama (NA)
Black proportion of population 27
My graph
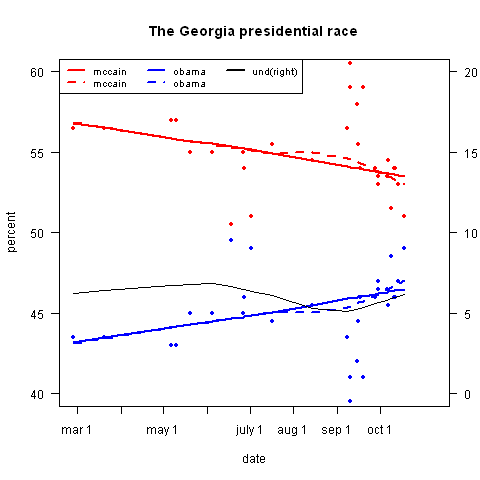
My prediction Obama by 1
Indiana 11 EV
Pollster McCain + 3.1 (up 1.3)
538 35% Obama (down 16)
Black proportion of population 7.6
My graph
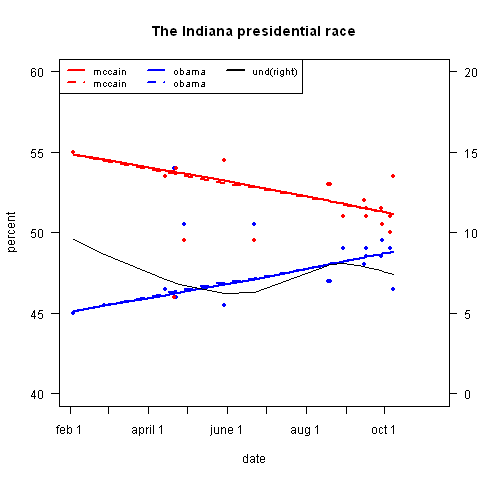
My prediction in IN Obama by 1
Michigan 17 EV
Pollster Obama + 9.8 (up 4.7)
538 98% Obama (up 8)
Black proportion of population 13
My graph
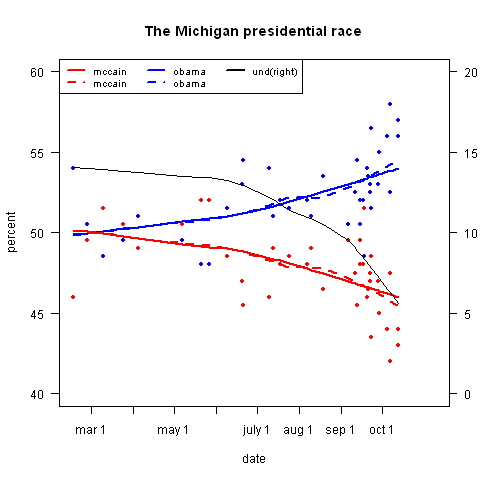
My prediction in MI Obama by 10
Minnesota 10 EV
Pollster Obama + 6.9 (up 3)
538 96% Obama (up 5)
Black proportion of population 2,7
My graph
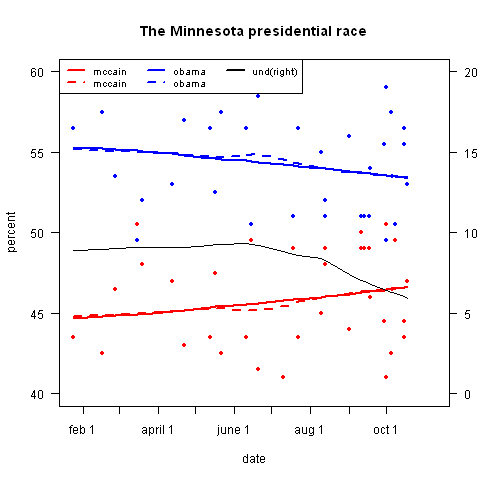
My prediction in MN Obama by 2
Missouri 11 EV
Pollster Obama + 0.9 (down 2.3)
538 65% McCain (up 22)
Black proportion of population 11
My graph
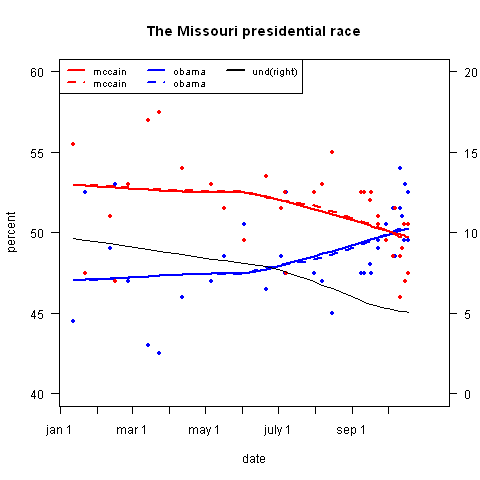
My prediction in MO Obama by 2
Nevada 5 EV
Pollster Obama +3.3 (up 1.8)
538 75% Obama (up 7)
Black proportion of population 6.3
My graph
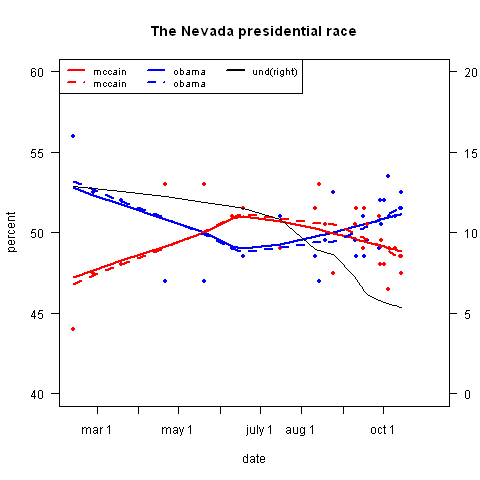
My prediction in NV Obama by 3
New Hampshire 4 EV
Pollster Obama + 6.6 (up 3.5)
538 92% Obama (up 12)
Black proportion of population 1.1
My graph
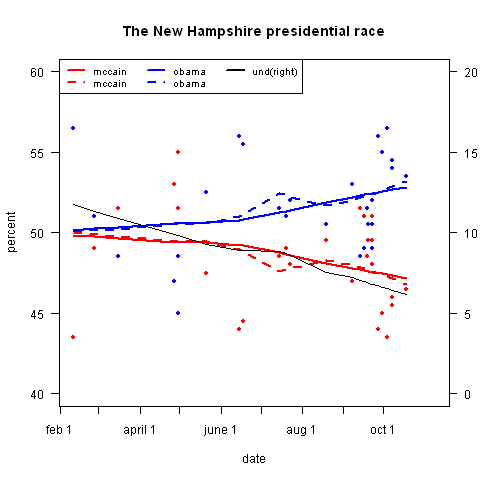
My prediction in NH Obama by 6
New Mexico 5 EV
Pollster Obama +7.5 (up 1.3)
538 93% Obama (up 3)
Black proportion of population 2.5
My graph
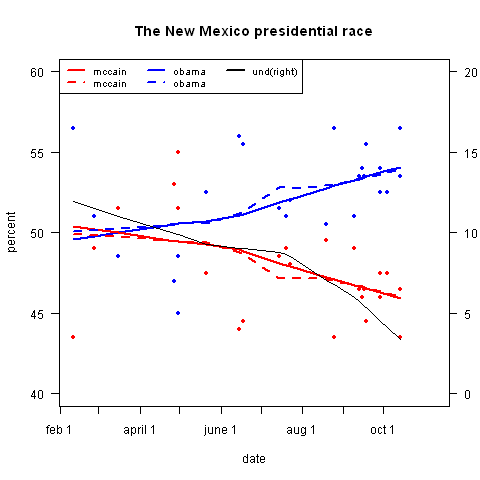
My prediction in NM Obama by 14
North Carolina 15 EV
Pollster Obama + 3.3 (up 2.9)
538 62% Obama (up 8)
Black proportion of population 20
My graph
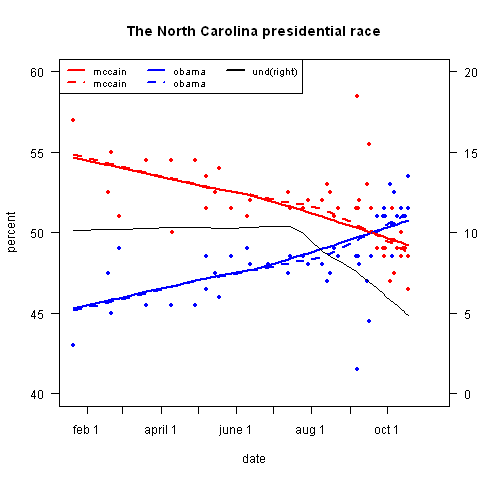
My prediction in NC Obama by 8
Ohio 20 EV
Pollster Obama + 2.7 (up 1.9)
538 72% Obama (up 3)
Black proportion of population 10
My graph
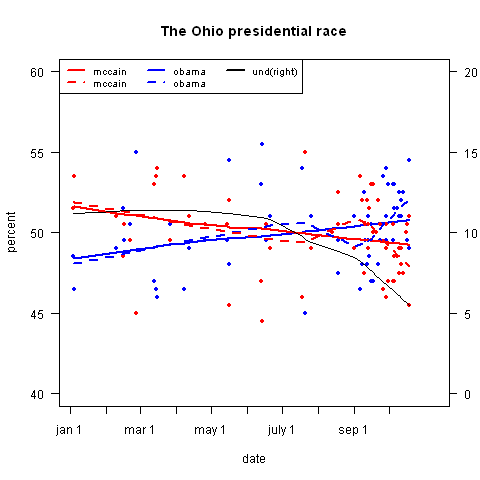
My prediction in OH Obama by 1
Pennsylvania 21 EV
Pollster Obama + 15.2 (up 8.9)
538 98% Obama (up 9)
Black proportion of population 8.1
My graph
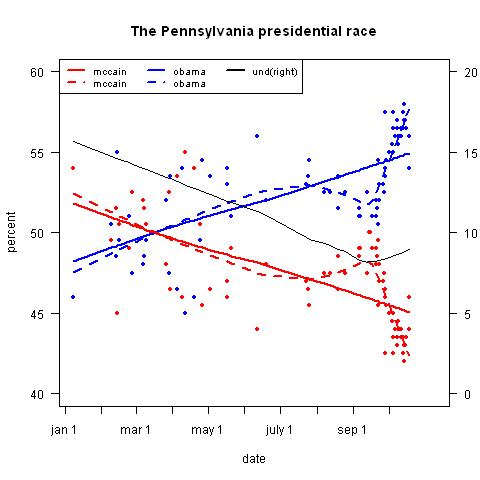
My prediction in PA Obama by 15
Virginia 13 EV
Pollster Obama +8.9 (up 5.6)
538 92% Obama (+5)
Black proportion of population 16
My graph
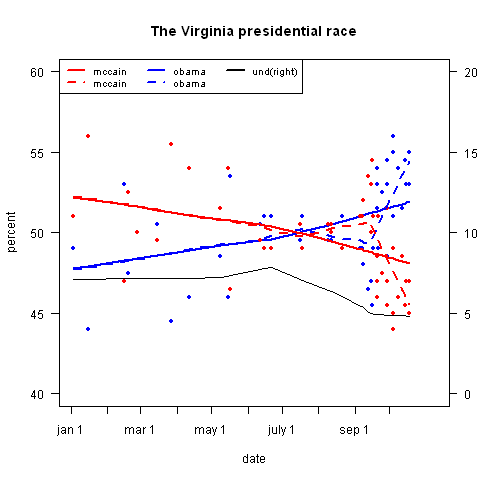
My prediction in VA Obama by 7
West Virginia 5 EV
Pollster McCain + 4.9 (up 0.3)
538 91% McCain (up 19)
Black proportion of population 2.5
My graph
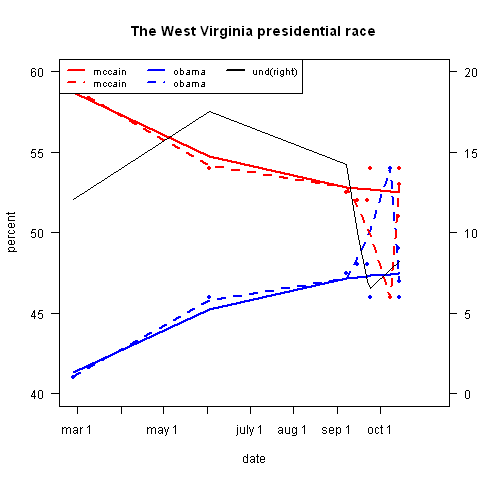
My prediction in WV McCain by 2
Wisconsin 10 EV
Pollster Obama + 8.1 (up 4.5)
538 99% Obama (up 6)
Black proportion of population 4.4
My graph
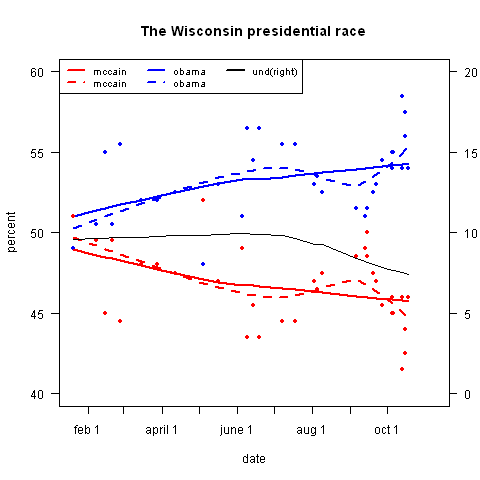
My prediction in WI Obama by 4
So.... my grand total ...
Obama 390 McCain 148
