This is my final prediction for the electoral college result. I feel fairly confident that Obama will get at least 353 electoral votes, with Colorado (or possibly Pennsylvania) being the tipping point state. The reddest state that Obama wins will be North Carolina, unless polls have completely flubbed on handicapping the influence of the campaigns' dueling ground games. If there is a recount, I think it will be in one of the following: North Carolina; Missouri; Indiana; or Montana.
Here's my map:
Conservative prediction:
Obama : 353
McCain: 185
Landslide Prediction:
Obama : 396
McCain: 142
Go under the fold to see how I decided.
- I consider that are potential swing states are within the following list:
AZ, CO, FL, GA, IN, MI, MN, MO, MT, NC, ND, NH, NM, NV, OH, OR, PA, VA, WA
- I then consulted the following websites with these states foremost in mind:
- I then compile the consensus among the various methods above (where my evaluation of the last point is rather subjective and justifies some tie-breaking) and make two predictions: conservative and optimistic. There are five states colored gray in my map: GA, IN, MO, MT and ND. I'm fairly certain that they will go to McCain, but I'm hedging that in the case of a wave election that they might go Obama.
My final compilation of all of these races is in this spreadsheet. You can also view it in HTML.
My special sauce in this compilation is the sensitive loess curve from Pollster.com. I use it to help make up my mind when the other methods leave me wanting more closure. I have highlighted the possible tipping point states in green and have highlighted my 5 "landslide" states in a bold red font. I have also highlighted PA because it is behaving VERY curiously in the sensitive trend. The "Predictions" tab shows my tabulation as of today.
I'm fairly confident that I'm not overstating Obama's support for three reasons:
- Obama's ground game is stronger;
- The Bradley/Wilder effect is dead;
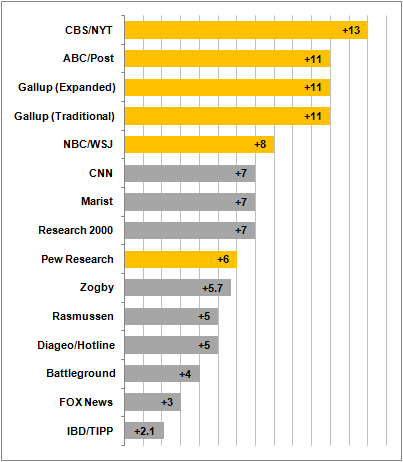
- The Cellphone effect helps Obama (see also the followup; The yellow polls include cellphone only users. Take home: Obama is being low-balled by many pollsters):
Also in the spreadsheet is a tipping point analysis for each of the methods where I could order the states. The "PollsterTP" tab is for Pollster.com's default trendline, "S-PollsterTP" is for their high sensitivity trendline, and "538" is for fivethirtyeight.com's win percentage rankings. These tables will be fun little aids during the election. It is much easier keeping track of a single state in each list (3 total states) than all 50.
A tipping point (by my definition) is the state that puts Obama over the top when the states are ordered from most likely to go Obama to least likely to go Obama. Notably, CO is most likely to be that state, which is good news for the good guys, as it is solid blue. In all three tipping point tables, NC is consistently the most tenuous blue state on my map, so watch for a recount there. The most questionable red states on my map are MO, IN, or MT, depending on the analysis. Watch there for recounts, too.
I could be VERY VERY wrong, probably by being too optimistic for Obama. But hey, it is no fun unless you put something on the line. Here's my reputation (such as it is) for the taking.
