This morning in the news there were reports about a Brookings Institution Study that analyzed carbon footprints in the top 100 US Metro areas by carbon footprint per capita.
In looking at the map, something looked awfully familiar.
DHinMI did a couple of front-page stories about Obama's Appalachian problem, with nice color-coded maps of the vote by county where Clinton got more than 50%.
Strange but true: the top 12 worst carbon-emitting metro areas in the report are in a band stretching right through "Clinton Country." Why? Who knows? Call Mark Penn for an explanation! Speculation and a map on the flip.
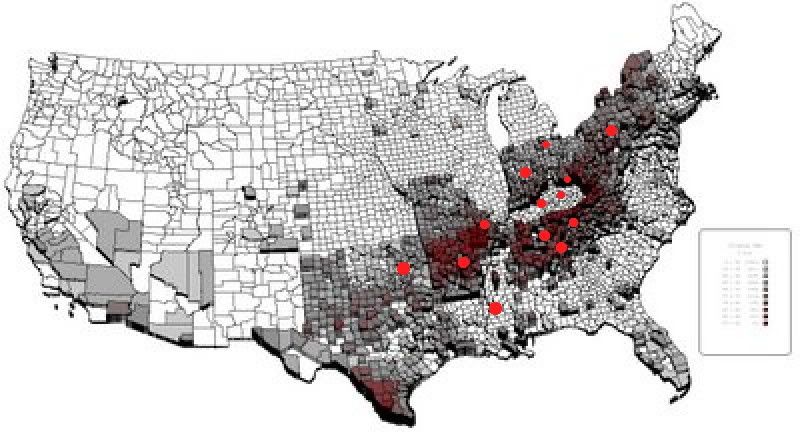
Sorry for the primitive graphical markup by yours truly. A graphic artist I ain't. This is a combination of the map from DHinMI's diaries and the Brookings Institution data. (I tried to make stars instead of circles, but I failed utterly to get the widgety thingy to work.)
So, here's my random speculation. These are "old economy" counties, rural, poor, and many of them have roots in the extractive industries. The conditions that have created economic distress for what some might call "bitter" people and others might call "hard working white people" are the same as have created pollution problems. You have to drive farther to get to work and to services, hence more cars, there's no civic money for things like public transportation, and the industries that are there get to escape regulation a bit more than in the rest of the country where folks aren't as wholly dependent on a few employers. Additionally, all the secondary effects that go into environmental awareness -- education, multiple opportunities, connection to the global economy directly, etc. -- are harder to come by as a result of the economic history of the region in question.
Or, maybe it doesn't mean anything.
Your thoughts?
