[Cross-Posted on my site, Vegan Fish Tacos]
I've been wanting to do something like this for quite some time. Basically, what I am trying to do is paint a visual picture of how this election is really shaping out. Since it is really the Electoral College that is all that matters (though national polls hold a small amount of probative value), that seems like the way to do this. What I have done is taken the projection % chances for both candidates by the venerable Five Thirty Eight on August 1 and will work from those.
[NOTE: I wrote this for a much less politically savvy audience, so don't feel patronized if feels far below your level- that's the difficulty of this]
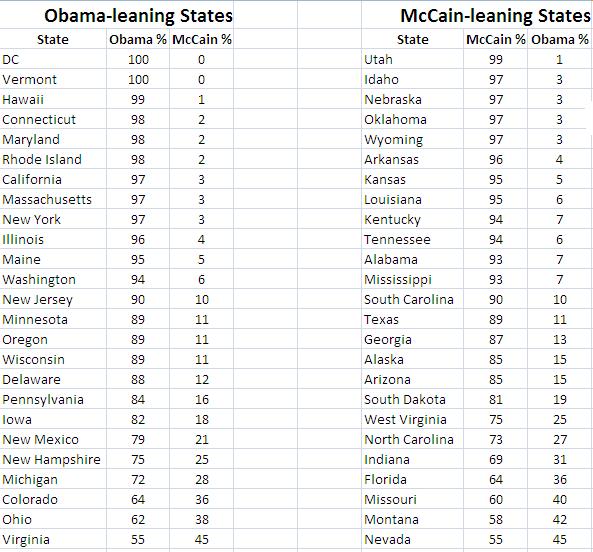
Here is how the states shake out with that data in terms of each candidate- keep in mind that the % represents the proportion of the time (through simulations) that each is projected to win a given state- the margins can differ from the percentages a fair amount, though there is naturally a degree of correlation.
How I process this data is by using 270 To Win to make electoral maps. Starting at the most likely states for each candidate and working down shows the evolution of the strength of support in terms of the electoral map.
[NOTE: Here's a link to my Flickr-stream of the images if you prefer that]
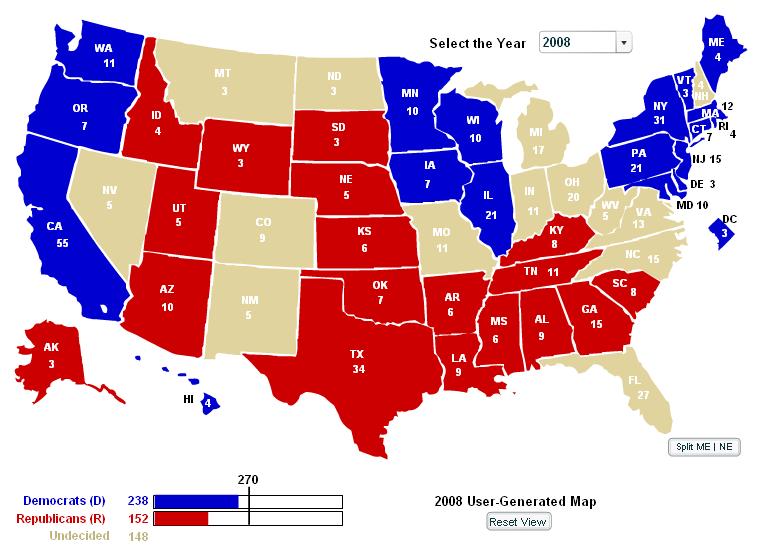
First up is the "95% Club", which is all of the states where either candidate has a 95% chance or better of winning it right now. These would be considered "locks" or base states
[Note: I know the map quality isn't fabulous- that's what happens when you use Paint and PrintScreen to make them uploadable.]
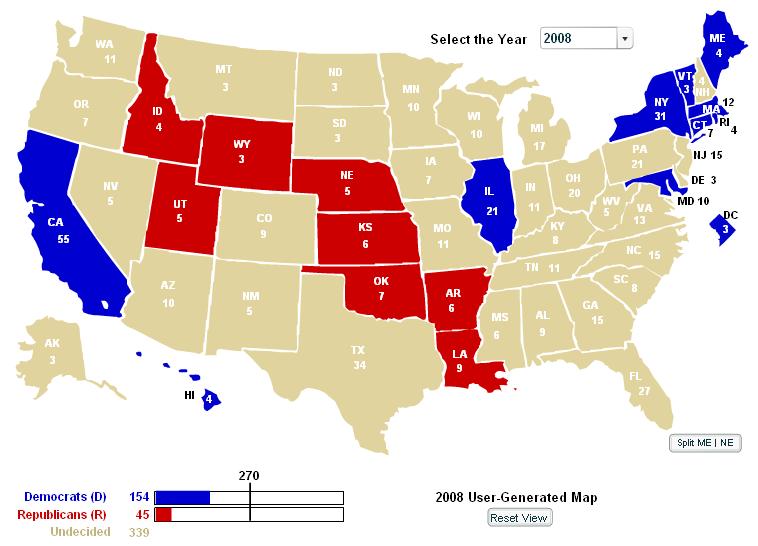
The most jarring element here is just how big the electoral difference between the two sets is. With just the 95% Club, Barack Obama is more than halfway to the Presidency.
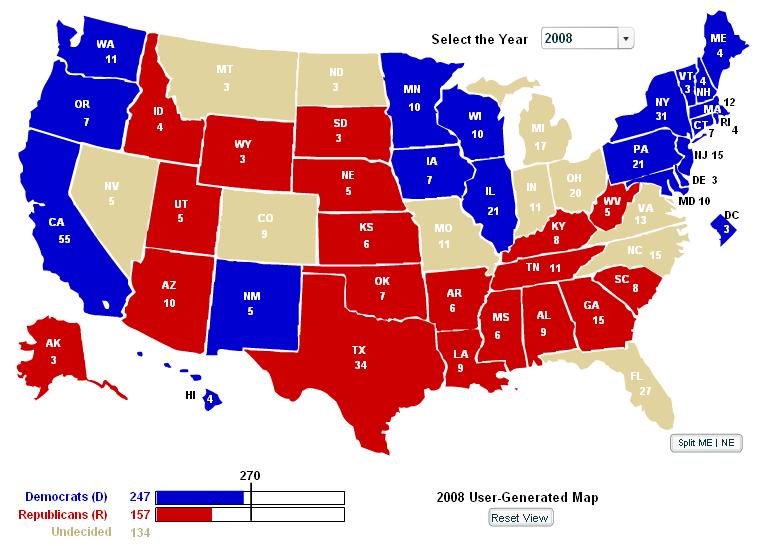
Next up is the 90% Club, which brings surprises of its own.
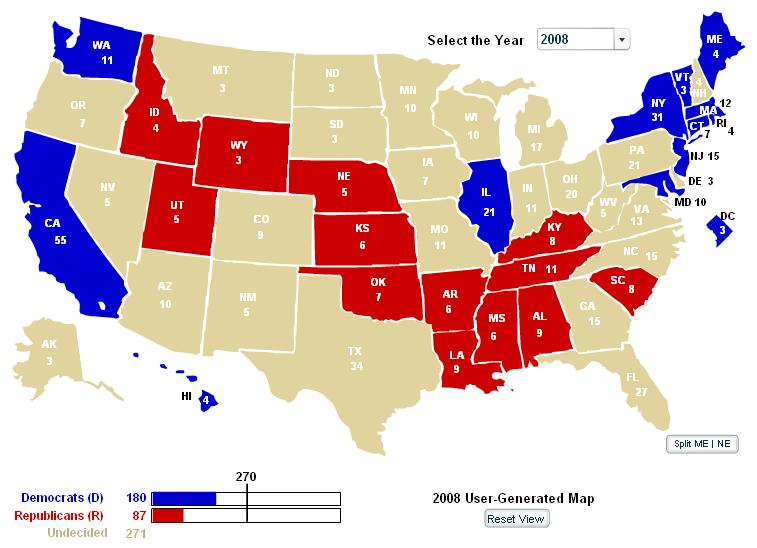
Here McCain gains the Southern element with Mississippi, Alabama, Kentucky, and Tennessee (among others). What makes this one compelling is that MS, AL, and TN combine to exactly the same number of electors as Washington and New Jersey (26). Just goes to show how the apportionment matters.
Next up is the 85% Club:
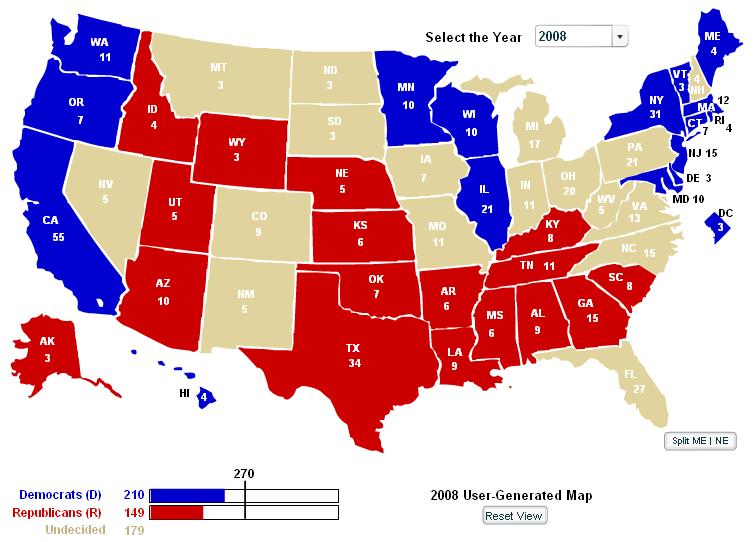
This is the group where McCain gains the other big part of his support, adding in Texas and Georgia, two of the bigger population states on the GOP map this cycle. The 85% Club brings McCain to more than halfway to the Presidency, but Obama is exactly 60 electors away with 17 states on the board, which could prove problematic. Also, this map includes Minnesota (where the GOP is holding there convention) and Wisconsin (typically much more of a swing state). It is also worth noting that this map pretty much represents the last of the truly stable states (though I think Alaska is different from that group, for reasons I will get into later.
Here's the 80% Club:
The difference between the 80 and the 85% Clubs is small, but important, with Pennsylvania, Iowa, and South Dakota being the only additions. Pennsylvania's inclusion is the most relevant, because McCain has put in a fair amount of time/effort (including the fact that it is where he was today with Tom Ridge) for a state this high on Obama's list.
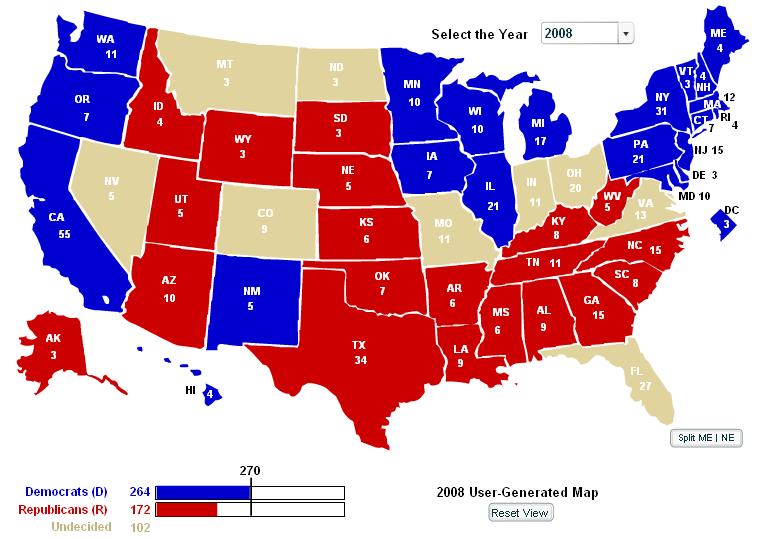
Next up is the 75% Club:
The 75% Club holds particular significance because it represents what I call "The Landslide Board". Essentially, if any state in this grouping changes hands from where it is on this map, we won't be talking about "Who wins?" we'll be talking "How much?", with the exception of Alaska. This map also serves as the one I use as a base for building hypotheticals, because there are rational arguments at this juncture for each of the unallocated states to change from where they are leaning. Keeping that in mind, the next thought should be to look at the Electoral Vote count (EV), which is jarring in terms of the Main Stream Media's horse-race theme. From here, Obama needs 23 total EV's to take the White House, with some huge states still on the board.
From here, we move into shakier ground with the 70% Club:
This small group of added states acts as the "Heavy Lean Swing" group, where it looks right now like they'll be in those columns in November, but they could change. Intuitively, these could be added to the "Landslide" grouping (as in, the other side winning each of these states would only happen in a dramatic win), however each has unique attributes that make it swing-able in other circumstances. Another major impact on the narrative is Michigan's inclusion on the list. If this map holds, it spells doom for McCain's chances, as Obama needs just one more state of 5 EV's or more to get the Presidency, which let's just say is quite doable. This explains McCain's urgency in Michigan and the possibility of his selection of Romney, which will be discussed much more later.
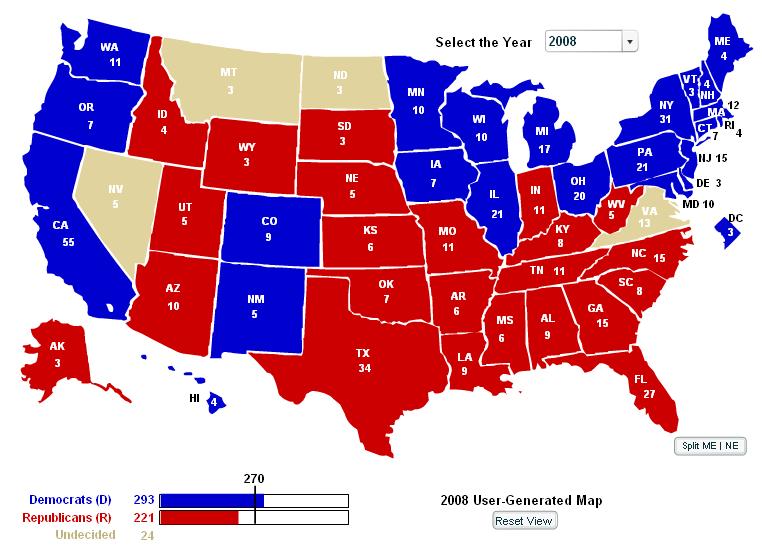
Now on to the 65% group, which holds less meaning (but still some):
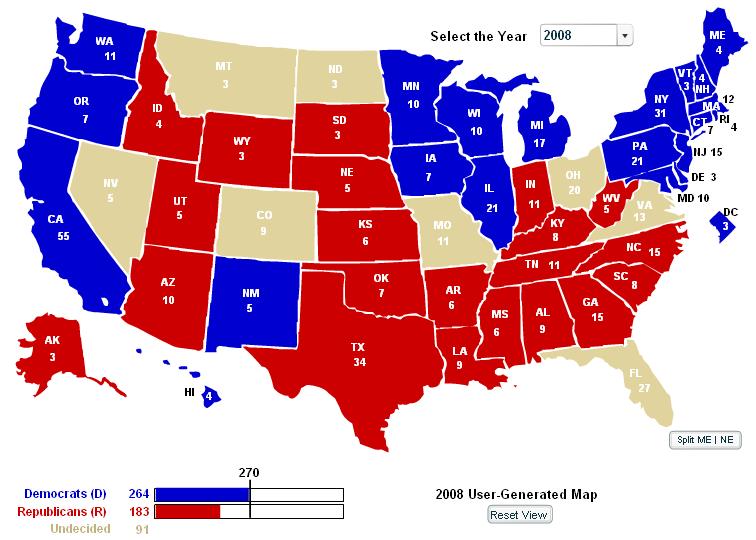
This is not too different than the last map, with the only addition being Indiana. In a sense, the value of this map is showing how much more the still-up for grabs states are swing-able than the rest. Just to add to it, from this map, John McCain must win Florida, Virginia, Ohio, Missouri, Colorado, Nevada, and one of Montana and North Dakota to win.
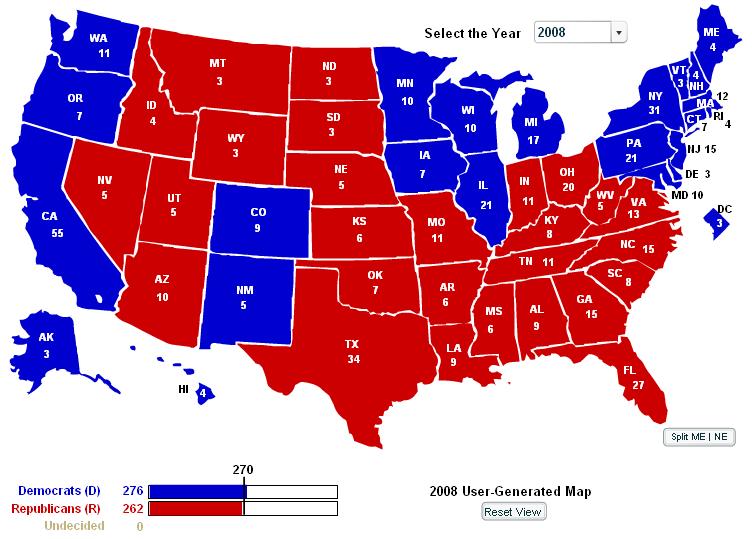
I'll include the 60% Club and the 55% Club, with commentary after both:
What makes the 60% one matter is that Ohio is more likely to go to Obama than Virginia, according to 538. This makes a degree of sense and also seems a little bit shaky to me (not Nate's method or the data, just my gut). The 55% Club also represents the final distribution right now, meaning that no state is closer than Virginia and Nevada's 55% leans to Obama and McCain, respectively. That in and of itself shows that the map is a little more settled than popular opinion sees it, though a 60/40 split is so inherently close to a 55/45 or 50/50 considering how many moving parts there are in the next few months.
From this point, I'm going to post two different maps that are two hypotheticals that I find interesting. First is the "Romney Special":
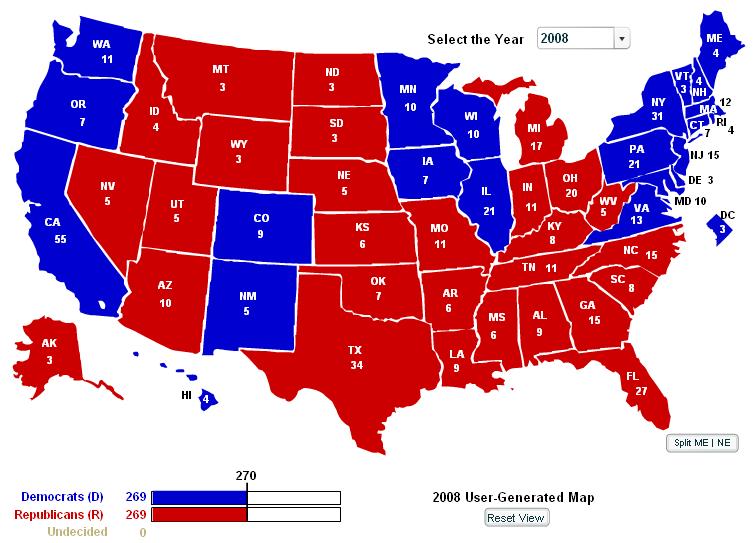
This is by no means a projection of how the election would play out if McCain picks Mittens, but it is one hell of a scenario. Basically, it swaps Michigan and Virginia, with Ohio changing hands as well. This makes for an Electoral College tie, which would then be settled in the House of Representatives, with each state getting one vote total. Politico estimated last week that Obama would win in that hypothetical, but it would be insanity (though I agree with their projection of the end result).
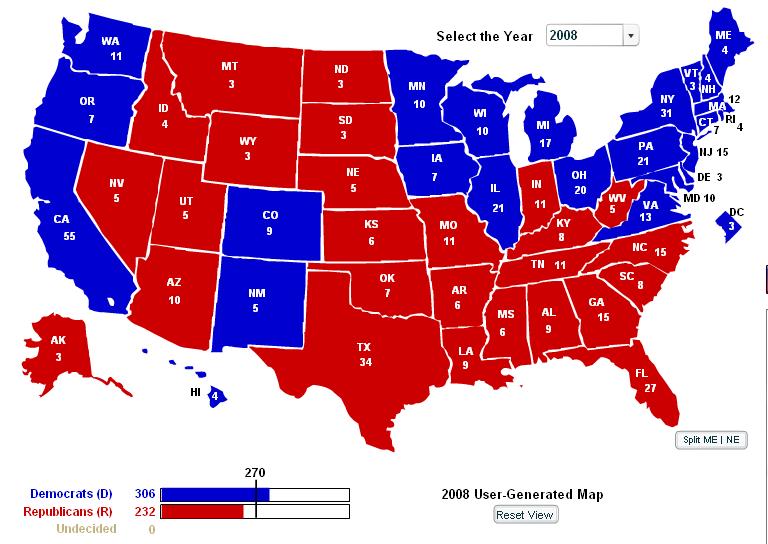
The last map I'll show is my personal projection (as of now) of how this election will shake out:
There aren't a ton of differences between my predictions and 538's, but the differences are pretty important (of couse, I didn't take VP's into account, though their electoral impact is often minimal).
Here's the logic:
- I run under the assumption that "Ohio Always Disappoints". Unless the polling data becomes astonishingly reliably Democratic there, I will put it in the red column in my own projections. It's just the way it is.
-Alaska is a total gut call, with some personal knowledge to back it up. If you take the current 538 percentages for Obama and McCain and tie them to the 2004 Presidential Election turnout, the total difference in votes between Obama and McCain is 23,386 people. That's simply astonishing. If you assume that some of the movement would come from Mc894/899 (I put it at half), Obama would only need 15,590 people to change the state from Red to Blue. I think he's going to make a visit, being the first Presidential candidate from a "Big Two" party to visit since Nixon, and take the state.
-Virginia is the hardest state to predict. There are so many factors that scream Obama, but I still can't shake the Beltway fever combined with the part of Appalachia.
Beyond that, I'll let the numbers (and maps) speak for themselves, at least for now.
