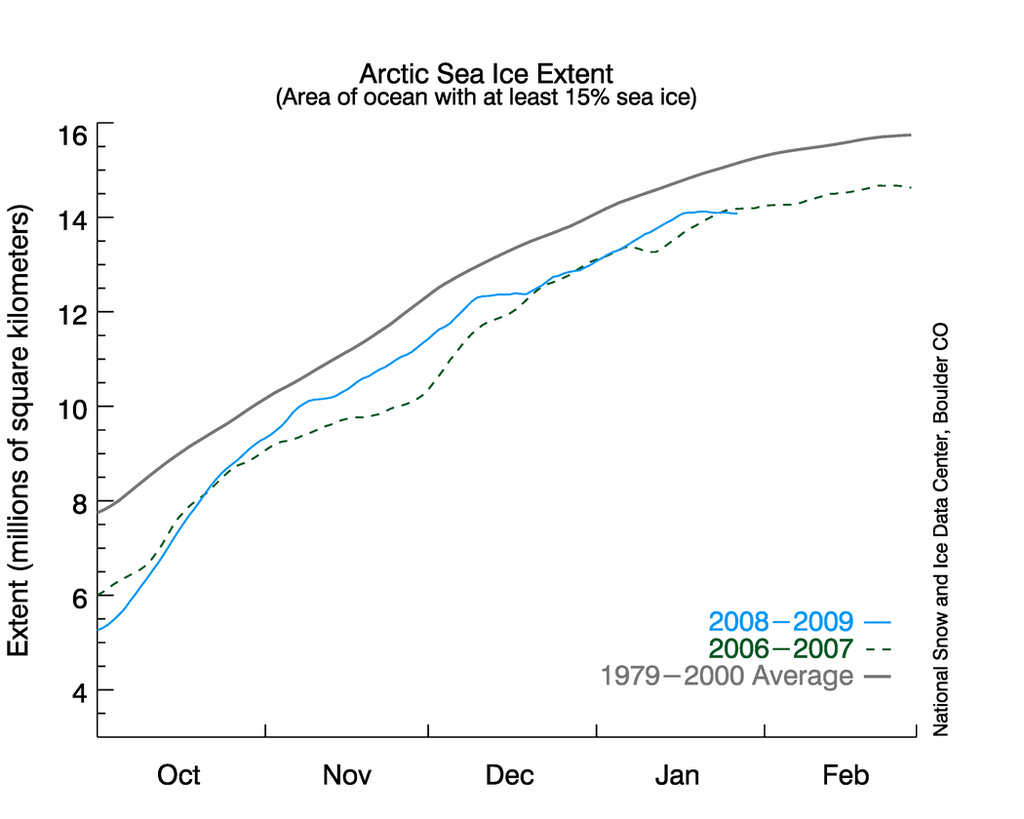
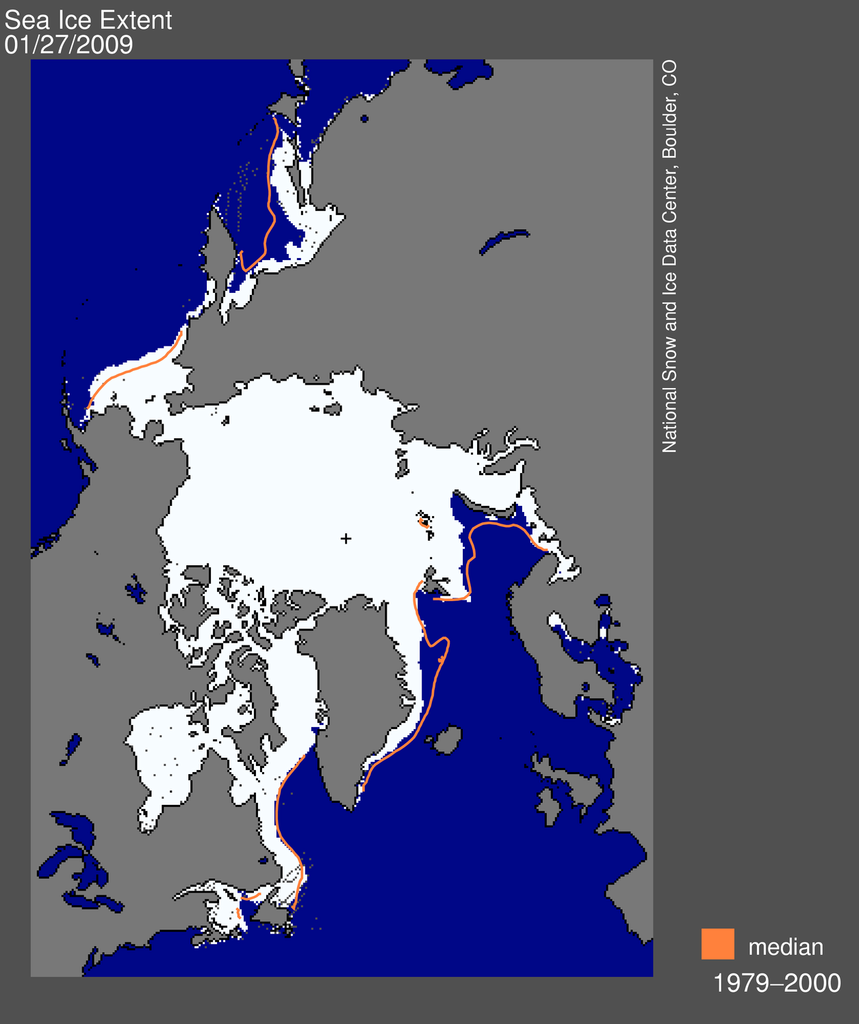
The hiatus in the refreezing of the Arctic continues. Today's NSIDC data shows that this year's refreezing has now dropped below the rate for 2006-2007, the year of the record summer sea-ice melt. Here are the latest NSIDC maps and graphs.
Both images from National Snow and Ice Data Center
I have not seen an explanation yet for why this is happening. A similar phenomenon occurred in December. At that time the NSIDC offered the following explanation:
Reasons for December's pause in ice extent change
December's week-long pause in expansion of the ice cover appears to have been caused, at least in part, by an anomalous atmospheric pressure pattern. High pressure over Alaska and the European Arctic, coupled with unusually low pressure east of Greenland and over eastern Siberia, brought warm southerly winds over much of the Arctic Ocean. The southerly winds helped keep the ice edge from expanding southward. In addition, warm sea surface temperatures, at least in the Barents Sea, inhibited ice formation.
Chart showing year-long extent lines for 1979-2000 average, 2007, and 2008Figure 4. This timeseries from January through December shows the natural waxing and waning of the Arctic sea ice cover with the seasons. The maximum extent generally occurs in March, the minimum extent in September. Sea ice extent in 2008 (purple) fell well below the 1979 to 2000 long-term average (gray) and was slightly above 2007 (dashed green), in which the lowest summer minimum and the second-lowest winter maximum occurred.
Torsten Hanssen has pointed out the following very interesting web site run by the Japanese Aerospace Exploration Agency (JAXA) where you can download, in spreadsheet format, day-by-day sea ice extent data going back to June 2002. The quickest way to get to the data is to go to this page where you'll find a very interesting graph.Once you're on the graph page you can click on the data download button under the graph to download the spreadsheet.
The data here is slightly different from that on the NSIDC graph. After you've downloaded the spreadsheet, which is very simple, take a look at the data for January 2009. You'll notice that sea ice reached it's maximum extent so far in 2009 on January 19th and that since that date it has stayed below that January 19th figure.
You can also copy the data from January 19, 2007 and paste it next to the corresponding data from 2009. You'll then see that the two data sets are very close at this point (within 64,000 km2 as of yesterday) and that on January 25th, 2009 the sea-ice extent fell below the January 25, 2007 extent.
I don't know that one can yet draw any conclusions about this upcoming summer's sea-ice melt from all of this. That should all be clearer in a month or so. What is clear is this. To the denialists' chagrin, so far there has not been any big refreeze of sea ice in the Arctic. Indeed, instead it's tracking very similarly to how it tracked in 2007, the year when the record for minimum summer sea-ice extent was set.
Related post:
European Space Agency Confirms that 2008 Sea-ice Volume Reached Record Low
Crossposted at Climaticide Chronicles
