I went back and looked at a bunch of numbers from 2008. Unfortunately, the economic numbers are pretty bleak (and still getting worse).
U.S. Population:
January 2008: 302,785,808
December 2008: 305,313,980
Unemployment:
January 2008: 4.9%
November 2008: 6.7%
Inflation (Nov 2007-Nov 2008):
All items: 1.1%
Food: 6.0%
Energy: -13.3%
All items less food & energy: 2.0%
Hunger (as of Dec 2007):
Food Insecurity: 11.1% of all U.S. Households
Hunger: 4.1% of all U.S. Households
Hungry Children: 691,000
*These numbers are expected to get worse in 2008, as unemployment went up and so did food prices. The numbers here are the most recent ones released by the USDA.
(I had to take the tables out of this because the HTML was giving me headaches - see the full diary on my food blog)
What We Eat
All data from USDA ERS 2008
Our Favorite Vegetables (In Calories per Capita per Day)
- Potatoes: 70.4
- Tomatoes: 7.7
- Sweet Corn: 7.55
- Onions: 5.4
- Carrots: 3.2
- Lettuce: 3.2
- Sweet Potatoes: 3.1
- Garlic: 2.5
- Cucumbers: 1.95
- Green Peas: 1.7
- Broccoli: 1.43
- Snap Beans: 1.35
- Cabbage: 1.29
- Chile Peppers: 1.04
- Bell Peppers: 0.88
Sweeteners (Calories Per Capita Per Day)
- 343.0 sugar, 53.6 corn sweeteners
- 281.9 sugar, 119.1 corn sweeteners
- 217.0 sugar, 225.3 corn sweeteners
- 220.9 sugar, 275.7 corn sweeteners
- 210.1 sugar, 252.8 corn sweeteners
(I assume the recent decrease in caloric sweeteners has a lot to do with the introduction of Splenda.)
For more in this section go to my blog.
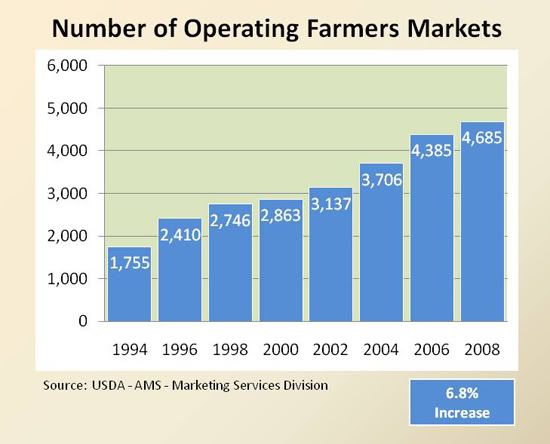
Farmers Markets, CSAs, and Roadside Stands
# of CSAs 1990: 60
# of CSAs 2007: 1150
States with the Most Farmers Markets (USDA AMS 2007)
- California
- New York
- Iowa
- Illinois
- Pennsylvania
- Wisconsin
- Michigan
- Massachusetts
- Ohio
- Kentucky
U.S. Demand for Locally Grown Food:
- $4 billion
- $5 billion
2012 (estimated): $7 billion
Indeed, the popularity of farmers markets has grown so rapidly in the United States that a recent national survey reports that 2 percent of U.S. food shoppers now say farmers markets are their primary food shopping venue.
Source: USDA Report on Supply Chain and Food Marketing 2008
Farm To School:
# of Programs: 2016
# of Schools: 8776
The Organic Outlook
Organic Food Sales
- $1 billion
- $20 billion (estimated)
- $23.6 billion (projected)
Source: Organic Trade Association 2008 mini-fact sheet
Organic Market Growth & Penetration
- 19.2% growth, 0.9% penetration
- 17.6% growth, 0.9% penetration
- 21.0% growth, 1.2% penetration
- 20.7% growth, 1.4% penetration
- 17.3% growth, 1.6% penetration
- 20.2% growth, 1.9% penetration
- 14.6% growth, 2.2% penetration
- 16.2% growth, 2.5% penetration
- 20.9% growth, 2.8% penetration
Source: Organic Trade Association 2007 Manufacturer Survey
In 2006, according to the Organic Trade Association, organic food market broke down as follows (numbers reflect percent of total organic sales):
Fruit & Veg: 40.0%
Dairy: 16.0%
Beverages: 13.0%
Packaged: 12.0%
Bread & Grains: 10.0%
Snack Foods: 4.8%
Sauces: 2.4%
Meat: 2.0%
Total: $16.718 billion (100%)
According to the Organic Trade Association, about 7 percent of U.S. organic food sales in 2005 occurred through direct sales at farmers markets and other nonretail direct market outlets (including sales to foodservice customers). In contrast, only 3.9 percent of all U.S. food sales in 2005 were made through any form of direct sale or home/mail order delivery.
Source: USDA Report on Supply Chain and Food Marketing 2008
Obviously, the numbers aren't in for organics in 2008 just yet. Since the economy totally tanked, particularly in the last few months of the year, I think it's reasonable to expect the organic market to take a hit. However, from what I've heard, organics will continue to see growth, just not at the high levels they did in the past several years. Existing organic shoppers are committed and willing to find ways to keep buying organic (i.e. grow some at home, stop buying expensive packaged foods, etc). With the economic situation, it seems that the biggest hit to organics will be in new customers - those who haven't given organics a try yet, who may be struggling financially now and less willing than ever to pay more for their food.
GMOs
Percent of All U.S. Soybeans Planted that were GMO (herbicide tolerant):
- 54
- 68
- 75
- 81
- 85
- 87
- 89
- 91
- 92
Percent of All U.S. Upland Cotton Planted that is GMO:
- 61
- 69
- 71
- 73
- 76
- 79
- 83
- 87
- 86
Of all cotton planted in 2008, 18% was Bt cotton, 23% was herbicide tolerant, and 45% were "stacked gene varieties" (which I assume means both herbicide and pest resistant). Could the decrease in GMO cotton between 2007 and 2008 have anything to do with the increase in organic cotton in the last year?
Percent of All U.S. Corn Planted That is GMO:
- 25
- 26
- 34
- 40
- 45
- 52
- 61
- 73
- 80
Of all corn planted in 2008, 17% was Bt corn, 23% was herbicide tolerant, and 40% were "stacked gene varieties."
Source: Adoption of Genetically Engineered Crops in the U.S.
Industry Concentration
From CONCENTRATION OF AGRICULTURAL MARKETS April 2007 by Mary Hendrickson and William Heffernan
Note: CR4 is the concentration ratio (relative to 100%) of the top four firms in a specific food industry. An industry is considered consolidated if its CR4 is 40% or higher.
Ethanol Production CR4
- 73%
- 73%
- 67%
- 49%
- 31.5%
Million Gallons/Year (Capacity)
- ADM: 1070
- US Biofuels: 250
- VeraSun Energy Corporation: 230
- Hawkeye Renewables: 220
Note: Farmer owned ethanol plants accounted for 39% of total capacity.
Dairy Processors in U.S. and Canada
Annual Sales
- Dean Foods: $10,106 Million
- Kraft Foods: $4,400 Million
- Land O’Lakes: $3,901 Million
- Saputo Inc.: $3,461 Million
Notes: Over 40% of Saputo Inc. plants are in Canada.
U.S. Food Retailing CR5
- 24%
- 38%
- 46%
- 48%
Top U.S. Food Processors
2005 Food Sales ($millions)
- Tyson Foods Inc. 23,899
- Kraft Foods Inc. 23,293
3 Pepsico Inc. 21,186
- Nestle (US & Canada) 19,941
- Anheuser-Busch Cos. Inc. 11,546
- Dean Foods Co. 10,505
- General Mills 9,803
- Smithfield Foods Inc. 9,614
- ConAgra Foods Inc. 8,195
- Swift & Company 7,847
