March was the hottest ever measured on earth, NOAA reported today.
The world’s combined global land and ocean surface temperature made last month the warmest March on record, according to NOAA. Taken separately, average ocean temperatures were the warmest for any March and the global land surface was the fourth warmest for any March on record. Additionally, the planet has seen the fourth warmest January – March period on record.
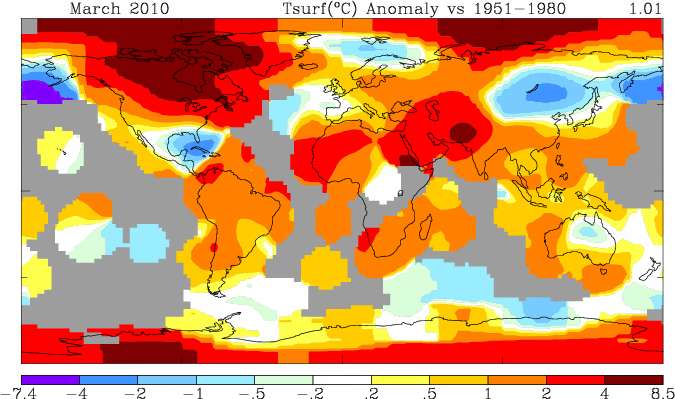
NASA GISS reported the hottest March globally using slightly different methods than NOAA for interpolation of temperature in areas without direct measurement over the oceans.
The previous record high for March set in 2005 was broken by slightly more than one tenth of a degree Celsius in 2010.

NOAA's analysis determined that the the January - March 2010 was the fourth warmest on record while NASA's analysis determined it was the second warmest by their methodology, but they both agreed that this was the warmest March ever measured. According to NOAA:
• The combined global land and ocean average surface temperature for March 2010 was the warmest on record at 56.3°F (13.5°C), which is 1.39°F (0.77°C) above the 20th century average of 54.9°F (12.7°C).
• The worldwide ocean surface temperature was the highest for any March on record: 1.01°F (0.56°C) above the 20th century average of 60.7°F (15.9°C).
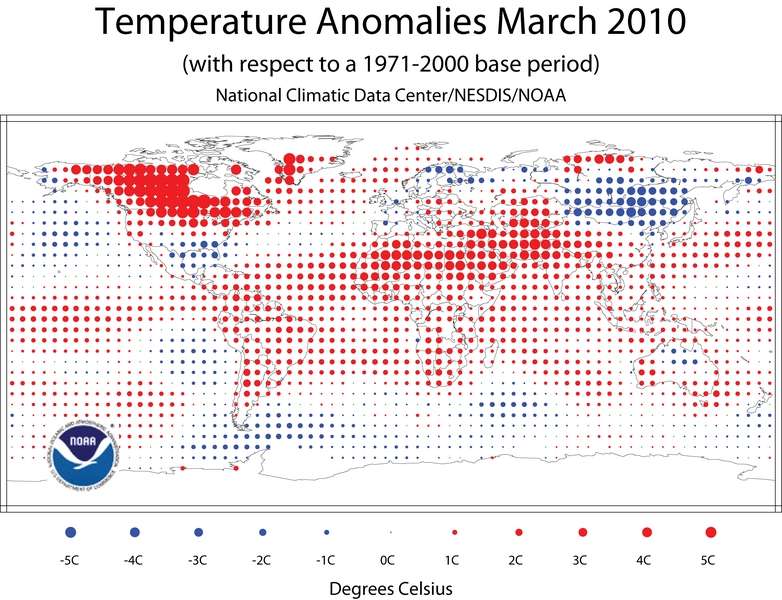
• Separately, the global land surface temperature was 2.45°F (1.36°C) above the 20th century average of 40.8 °F (5.0°C) — the fourth warmest on record. Warmer-than-normal conditions dominated the globe, especially in northern Africa, South Asia and Canada. Cooler-than-normal regions included Mongolia and eastern Russia, northern and western Europe, Mexico, northern Australia, western Alaska and the southeastern United States.
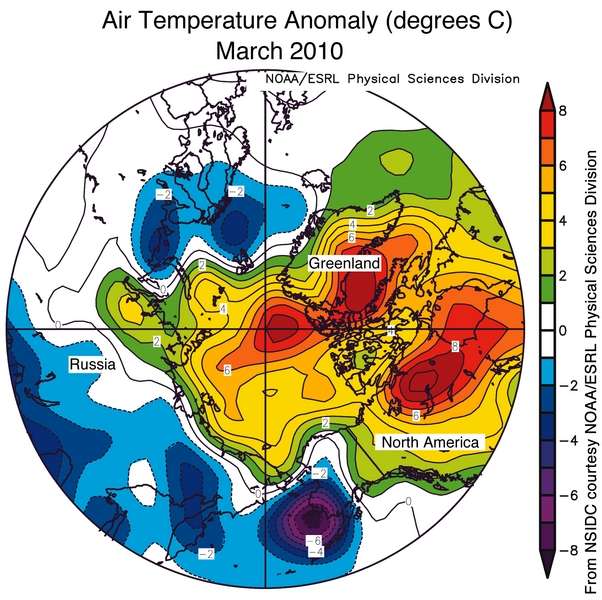
Temperatures in parts of the Canadian Arctic and Greenland were over 15 degrees Fahrenheit (8-10 degrees Celsius) above normal.
The high temperatures this March were affected by the moderate El Nino that began in summer 2009. However, this year's El Nino was not nearly as strong as the one in 1998 which caused a much higher spike above the long-term temperature trend line. Moreover this winter followed the longest and quietest solar minimum in 100 years.
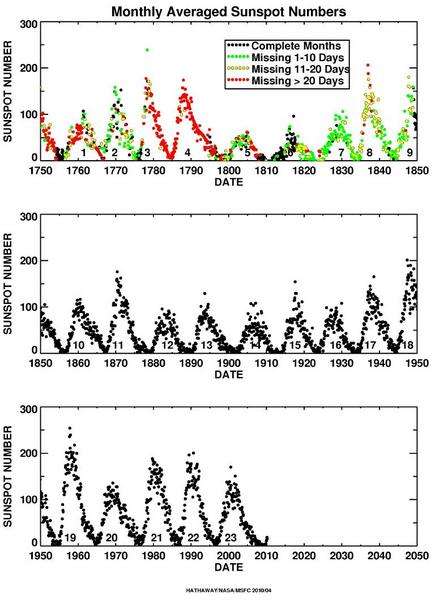
NASA's figure shows that solar activity peaked about 50 years ago in solar cycles 18 and 19. Note that global warming from 1910-1960 is partially explained by increasing solar activity. However, since then, reduced solar activity would. correlate with cooling, which has not been observed. The modest cooling effects of low solar activity have been overwhelmed by the strong warming trend caused by rapidly increasing levels of greenhouse gases.
Moreover, release of heat from the oceans due to changing ocean currents cannot explain the record temperatures this March. The oceans have been taking up most of the heat retained by increasing levels of greenhouse gases, slowing the atmospheric global warming trend.

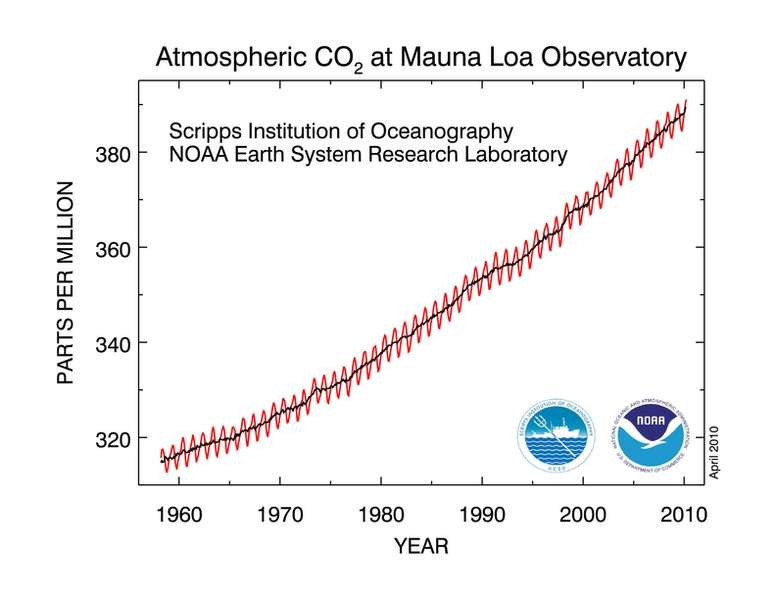
The record high temperatures are explained by record high CO2 levels.