The Democrats certainly did badly in the House elections. Below the fold is the first in what will be a series of looks at who did badly, why they did badly, and how it changed the Democratic House membership.
Today, I look at the liberal - conservative makeup of the old and new Democratic contingent in the House. There are several groups that rate congresspeople, but the one I like best is VoteView and particularly their ratings of every Senate and House since the first, which is here.
For this diary, I input these values for Democrats who won in 2008 (no matter how long they had been in) and those who won in 2010. Then I plotted the values. I created a kernel density plot of each set of scores. It looks like this
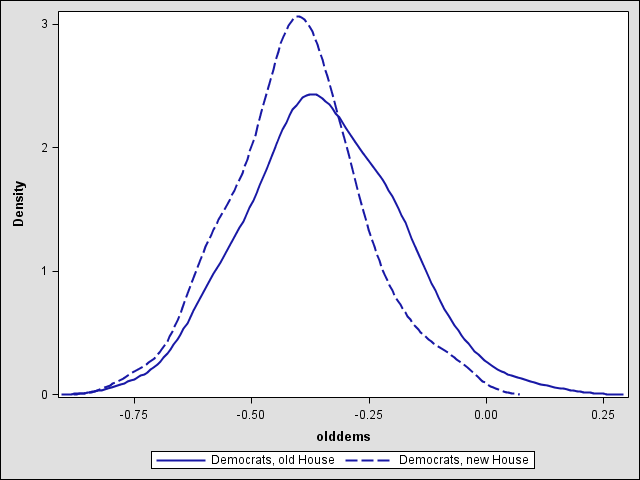
What does this mean? Well, scores farther to the left are more progressive/liberal. Those to the right are more conservative. The peak shows the most common rating; this moved slightly to the left. But the big change is that the right edge is much less conservative in the new House. In fact, very few Democrats got re-elected if their VoteView score was over 0.
Next, we can try to model which Democrats won and lost, and by how much, based on the Cook PVI score and the VoteView score. I am also including an interaction between the two, which looks at whether the effect of PVI is different at different levels of VoteView, or, more importantly perhaps, whether the effect of VoteView is different at different levels of PVI; and we'll include whether it was the incumbent who was running or not.
The resulting model is
Democratic margin = 4.49 + 20.53*VoteView + 1.50*PVI - 1.34*VoteView*PVI + 3.95*incumbent ran
and all the terms are highly statistically significant.
In words, this means that, in a district with a PVI of 0 (that is, the quintessential swing district), the predicted Democratic margin for a Democrat running for reelection in 2010 was 4.49 + 20.45*VoteView + 3.95 if the incumbent was running. Since a higher VoteView score is less progressive, that means that Democrats in swing districts did better if they were more centrist.
But most Democrats (even in the 2008-2009 congress) were not from such districts. In fact, only a little over a quarter of Democrats were from districts with PVI of 0 or lower (swing districts and Republican districts). The mean PVI in districts with a Democrat in congress was 8. When PVI = 8, the above equation says that the margin was
4.49 + 20.45*VoteView + 1.50*8 - 1.34*VoteView*8 + 3.95 if the incumbent ran
=
4.49 + 12 + (20.45 - 10.5)*VoteView + 3.95 for incumbent
=
16.49 + 9.5*VoteView + 3.95 for incumbent
which still indicates they did better if they were more centrist.
But for Democrats from the more progressive districts (say PVI = 15, the top quartile)
4.49 + 20.45*VoteView + 1.50*15 - 1.34*VoteView*15 + 3.95 for incumbent
=
4.49 + 22.5 + (20.45 - 20)*VoteView + 3.95 for incumbent
=
26.99 + .45*VoteView + 3.95 for incumbent
VoteView makes little difference.
Now, that might seem to indicate that Democrats should move to the center. But there are still a couple things left out: First, relationships might not be linear. Second, Democrats might already be doing what this model suggests - in fact, we know that Democrats ARE doig that - the most progressive Democrats come (in general) from the most Democratic districts.
The first question can be examined graphically:
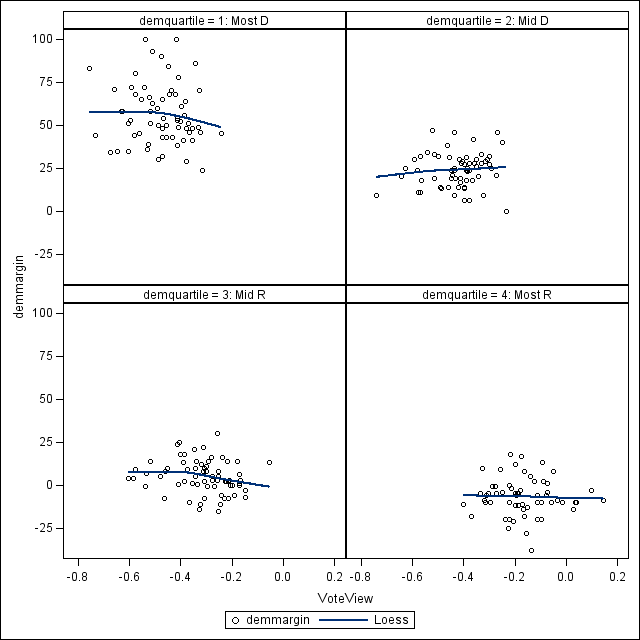
I divided the districts that had Democratic representatives into 4 groups, based on CookPVI. In the upper left are the most Democratic districts; next most is in the upper right, then lower left and finally lower right. In each quartile, there is not that much of a relationship between VoteView and margin. But districts that are more Republican have representatives who are more conservative.
