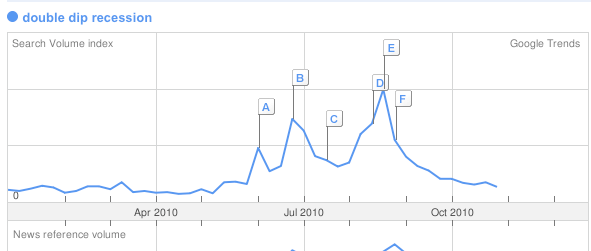
I took a break during the home stretch of the election season -- discussing the economy by that time would only have been divisive and a distraction from the more important work of the election effort. Now that it's over, this Google trends result for the phrase 'double dip recession is the single graphic that shows why the democrats got "shellacked:"
Half a year ago, I wrote that The November elections will turn on Jobs, Income -- and the price of Oil, in which I highlighted an article by James Surowiecki. Surowiecki cited research that refined the maxim, "It's the Economy, Stupid" to a more precise metric -- how were incomes growing in the second and third quarter of the election year? As we will see below, that is the single worst metric by which the economy could have been judged this year, and economic fears were highest at the worst possible time. Last Tuesday the voters held the democrats responsible.
More below the fold.
According to Surowiecki's article in the New Yorker magazine last spring:
"The old party gets credit or blame for the first year, and then it’s the new party’s economy," Larry Bartels, a political scientist at Princeton, says. "By November, it will be the Democrats’ economy."
[T]he high unemployment rate may be less important politically than you’d think. Seth Masket, a political scientist at the University of Denver, has found that, in midterm elections since 1950, there’s been no correlation between the unemployment rate and election outcomes. The key economic variable for voters, other studies show, has been income growth, or, more specifically, how fast per-capita G.D.P. is rising. In other words, if income growth is brisk enough, Democrats should benefit at the polls
...
Bartels, in his book "Unequal Democracy," points out a strong correlation between voting in Presidential elections and income growth during election years, rather than income growth over the full length of a Presidency. Indeed, he narrows it down further: the second and third quarters of the election year seem to matter most. Since the second quarter started just last week, there’s time for moods to brighten substantially by Election Day. Some have argued that an economic rebound won’t matter this year, because things have been so awful that normal growth won’t feel like progress. But, as Sides says, "it doesn’t seem that economic growth matters less when you’re digging out of a crisis. What voters look at is whether things are getting better or worse."
Through April, it looked like the recovery was really beginning to take off. We'd had two quarters of good GDP in a row, 4.8% in the 4th quarter of 2009, and ultimately 3.6% in the first quarter of this year. March and April saw non-census employment grow by more than 150,000 each month. Retail sales and industrial production were both increasing by more than 5% a year.
Then, within just a few weeks, the following all happened:
- BP's Macondo well at the bottom of the Gulf of Mexico turned into an Oil volcano
- the $8000 home buyer credit expired
- fears of a full-fledged Euro crisis filled up not just the business pages, but the front pages as well
- Oil briefly cost more than $90 a barrel
- 500,000 census workers began to get laid off
- state and local governments neared crisis in their fiscal year 2011 budgets as federal aid was about to expire
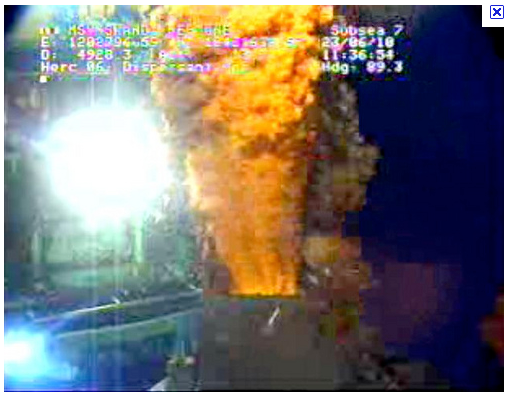
As a result, there was an Oil catastrophe in the gulf of Mexico, and economic decline in the affected gulf States. Obama looked weak and ineffectual as for nearly 3 months, deferring to BP, the Oil continued to spew. Who can forget seeing pictures like this daily?
When the homebuyer credit expired, housing permits, starts, and sales all collapsed (blue bars below). Construction workers began to get laid off again (red bars):
[praph] 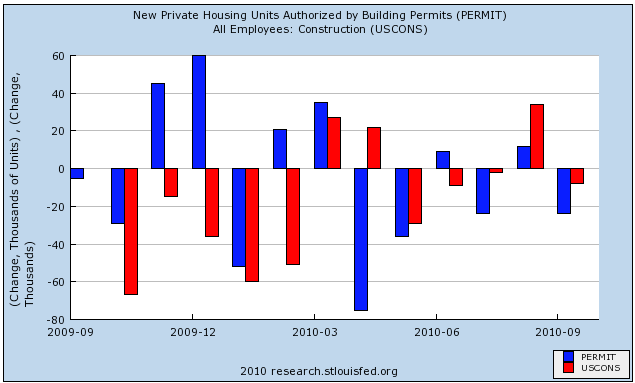
Fears of a Euro crisis caused short term rates in the credit market to rise suddenly. Here's a graph of the London InterBank Overnight Rate (LIBOR) as it shot up during spring and stayed elevated through July:
[graph] 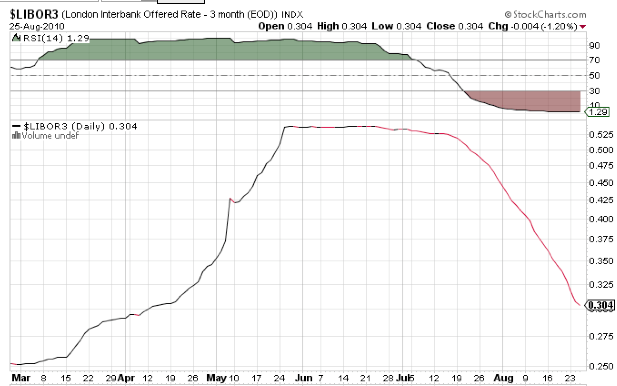
According to Prof. James Hamilton, whenever Oil has crossed the threshold of costing more than 4% of GDP, it has led to a recession. Oil came within a hair's breadth of that figure in late April.
[graph] 
As over 100,000 census workers were laid of monthly between May and September, each month news reports of the jobs report emphasized the negative headline number -- even though, leaving out the census workers, payrolls grew in each and every one of those months:
[graph] 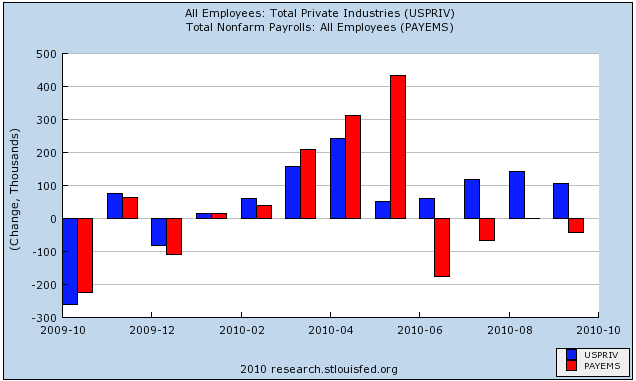
As the July 1 deadline neared, state and local governments sounded the alarm, with a study reporting that 250,000 more public employees might have to be laid off this year. As Congress dithered, and the Senate failed to make use of the 50 vote plus 1 reconciliation mechanism, and instead tried to find 60 votes to overcome a filibuster, the worst came to pass. In fact between January of this year and now, 240,000 state and local employees have been let go.
[graph] 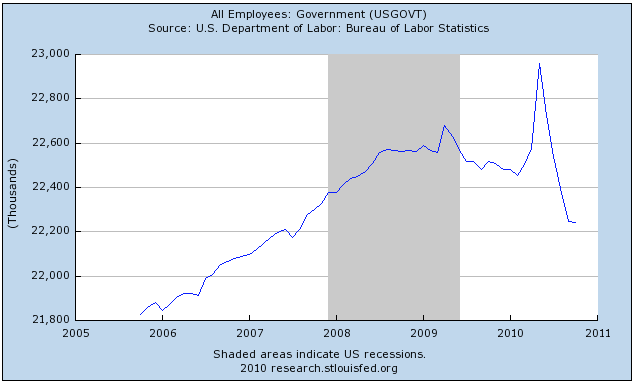
Hence the Google trends graph at the top of this diary, as the possibility of not just a slowdown in growth but an actual renewed contraction took hold (At least two frequently recommended diarists on this blog were sure that such a double dip would be happening by now). Consumers, who had been opening their wallets more and more, as shown in this longer term view:
[graph] 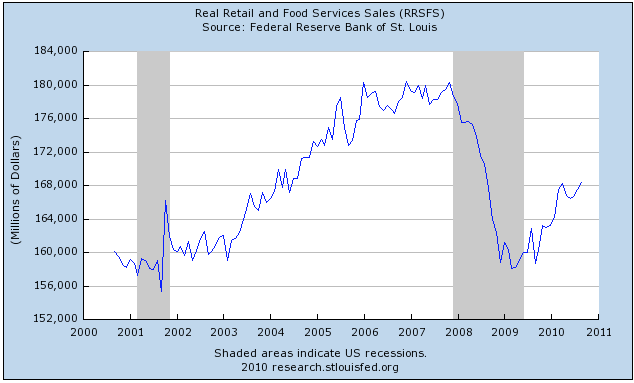
shut them again as retail sales declined in May through July:
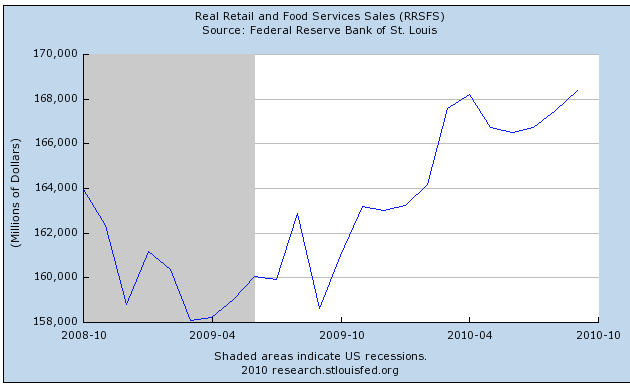
As I have argued in The Bonddad Blog, the series of events that unfolded in late April through May evoked a Pavlovian-type fear of a repeat 2008-style meltdown in both consumers and producers, causing both to temporarily freeze in their tracks over the summer.
The effect of all of the above setbacks, some of which were simply unlucky coincidences, but several of which were direct results of Congressional misfeasance (the poorly planned ending of the housing credit, the failure meaningfully to help out the states), was to knock back growth of GDP per capita substantially -- it was still growing, but the rate slowed down:
[graph] 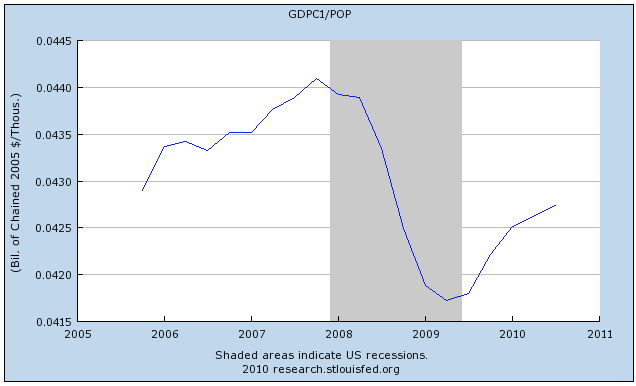
For what it's worth, both the number of unemployed:
[graph] 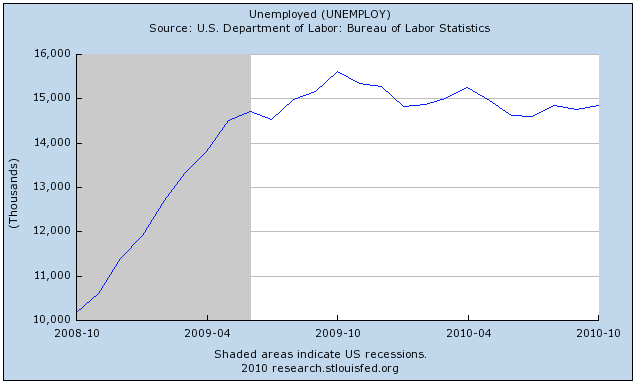
and the unemployment rate:
[graph] 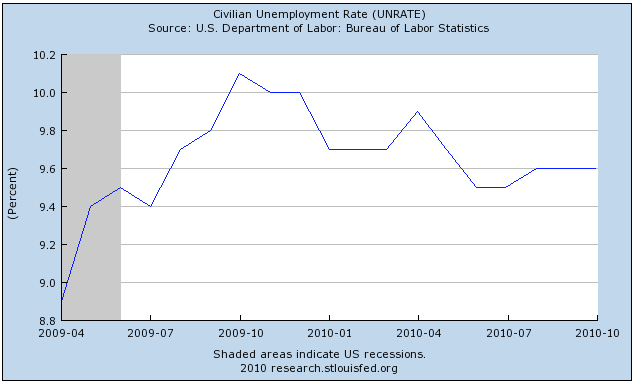
slowed their improvement to a trickle.
But Surowiecki's article tells us to focus on growth in income, and specifically such growth during the second and third quarters leading up to the election. Below is, first of all, a longer term graph of "real income", which is income minus government transfer payment (e.g., welfare) and normalized for inflation:
[grph] 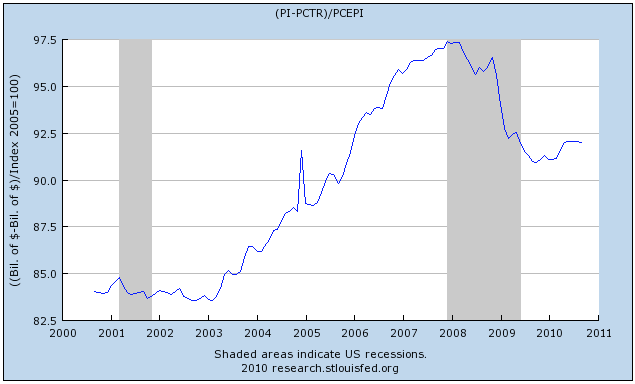
Now here is a look at that same graph for the last year:
[graph] 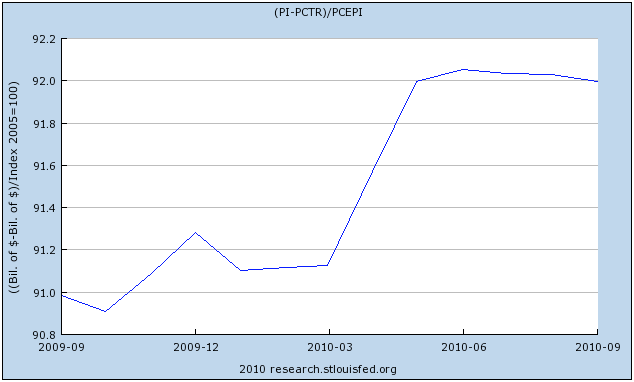
Notice what happened. Beginning in May, and continuing all the way through September, real income completely stagnated - in fact it declined ever so slightly. Moreso than jobs, it is the one coincident economic indicator that has barely budged off its bottom.
Consumer confidence, which had been on an upswing for a year, declined again in August, September, and October -- in fact it is virtually the only economic indicator in the entire gamut of indictators that has renewed an outright decline:
[graph] 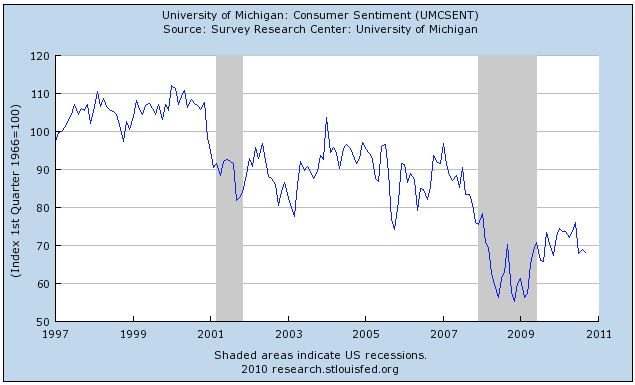
That decline in confidence in the economy going forward sealed the democrats' fate.
Many such as Prof. Krugman have made the argument that the Obama stimulus plan wasn't big enough. That may or may not be true, but one thing that is clear to me is that the stimulus didn't last LONG enough. As soon as it became clear in 2009 that the downturn was considerably worse than the Obama Administration had thought, it should have returned to economic stimulus and at very least extended the programs such as the housing stimulus, and aid to the states, until such time as unemployment declined to a much less worse level. Democrats may have delivered on "reform" however effectually or not, but their effort at immediate relief to aid the recovery was not nearly up to the task. For that failure they were "shallacked" last week.
==========
P.S. Actually, there is one other point worth mentioning. Mike Kimel a/k/a Cactus of Angry Bear several years ago published a study which showed that:
The Fed’s behavior seems to very closely approximate what one might predict if one believed the Fed was biased and acting on its biases.... In 9 of the 10 months leading up to and including November, the growth rate in real M2 per capita is fastest when there is an election involving an incumbent coming from the same party as the Fed Chair.... Similarly, for growth rates in real M2 per capita are smallest (and usually negative) when the upcoming election involves an incumbent from a different party than the Fed Chair.
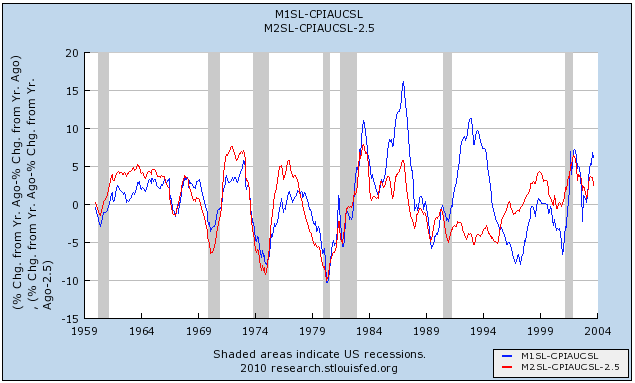
Well, here is what real, inflation adjusted M1 and M2 looked like this year. When both real M1 and M2 have gone negative, there has almost always been a recession. While real M1 didn't, real M2 did:
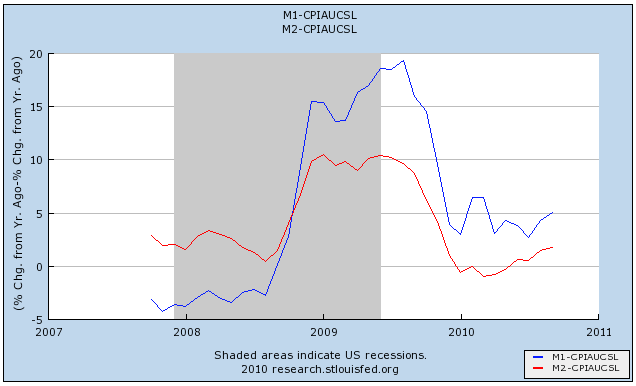
For some odd reason, noticeable at the time, the Fed allowed real M2 to go negative for most of the first half of this year. It was particularly odd because Bernanke is a student of Milton Friedman's study of the Great Depression, in which Friedman highlighted the role played by a constriction of M1 and M2. It was almost as if the Fed wanted to create a slowdown right in time to affect the midterm elections adverse to the democrats.
The same pattern of a drastic Fed slowdown in growth of M1 has occurred with a negative real M2 has only occurred once before:
under Alan Greenspan. In 1994.
