The NY Times has this graphic showing the extent of the surface oil slick as of yesterday:
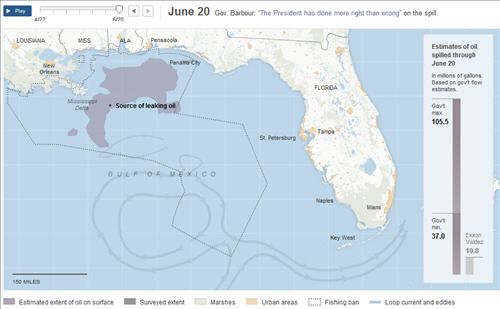
The grid squares on the map are about 70 miles on a side (~5,000 square miles each), and the total area of the slick as shown is about three of those squares, or 15,000 square miles of ocean surface.
The estimates of the oil flow rate from the well of course have been all over the park. A story yesterday reports that an internal BP memo pegged the "worst case" flow at 100,000 barrels per day.
So let's take that "worst case" estimate and see how it comports with the NY Times picture.
more...
If oil has been flowing at a rate of 100,000 bbl/day for the 62 days since the leak began on April 20, that amounts to 6.2 million barrels as of today. In metric terms, that's roughly 1 trillion cubic centimeters of oil.
It's perhaps counterintuitive to realize that this massive amount of oil if not spread out horizontally would fit into a container of relatively small extent. In fact, it would all fit into a cube 100 meters on a side. Of course, it's spread out into a very thin layer--but how thin?
The extent of the oil in the NY Times graphic, about 15,000 square miles, translates to about 400 trillion square centimeters. Neglecting any oil recovery to date, if all the 1 trillion cubic centimeters of oil was concentrated in the surface slick, the slick would average only 1/400 cm in thickness! Seems rather thin, no?
So what does the slick look like up close? Large areas of open water with clumps of oil? Or is the leak rate possibly actually much higher than 100,000 bbl/day?
