This diary is an update to my original smartmeter diary which can be found here.
My original diary has undergone a substantial rewrite in an effort to make it more clean and concise and to correct an incorrect assertion.(that my heater was 4kW)
Note that this diary is mostly graphics.
I tried to get help from my power company and they wouldnt respond in any decent way until I called a state senator and then they talked to me but gave me only one answer: "the temperature did it".
I wasnt happy with that so I filed an informal complaint with the Texas Public Utility Commission. Here is the majority of their reply to me:
During our investigation of your complaint, we required a response from Oncor regarding the usage. Oncor maintained that the usage recorded from 2/1/2011 to 2/4/2011 by the smart meter was correct. Oncor indicated that due to the rolling blackouts caused by the winter storm during the time, the smart meter was not able to transmit meter readings every 15 minutes. Since the meter readings were not recieved, Oncor estimated the missing usage intervals based on the beginning and ending reading taken each day. Although Oncor reported the usage was correct, the company has ordered a meter test to be completed to ensure the smart meter is accurately recording your usage.
Based on the information provided by you and Oncor, the Customer Protection Division has determined that the actions of the company were consistent with Oncor's Tariff for Retail Delivery Service, Section 4.7.2 regarding meter readings. Our review of the usage data confirmed that meter readings advanced during each interval and with each meter reading cycle for your billing. Aditionally, the tariff allows Oncor to estimate meter readings when actual readings are not obtained. As the meter readings after 2/4/2011 continued to move past the dispute period, we did not require the company to adjust the usage.
I didnt really expect much out of the PUC. They are not known for being on the consumers side. This is deregulated Texas and corporations run wild. You can see that the PUC's basic answer is that the data is correct because the meter kept going.
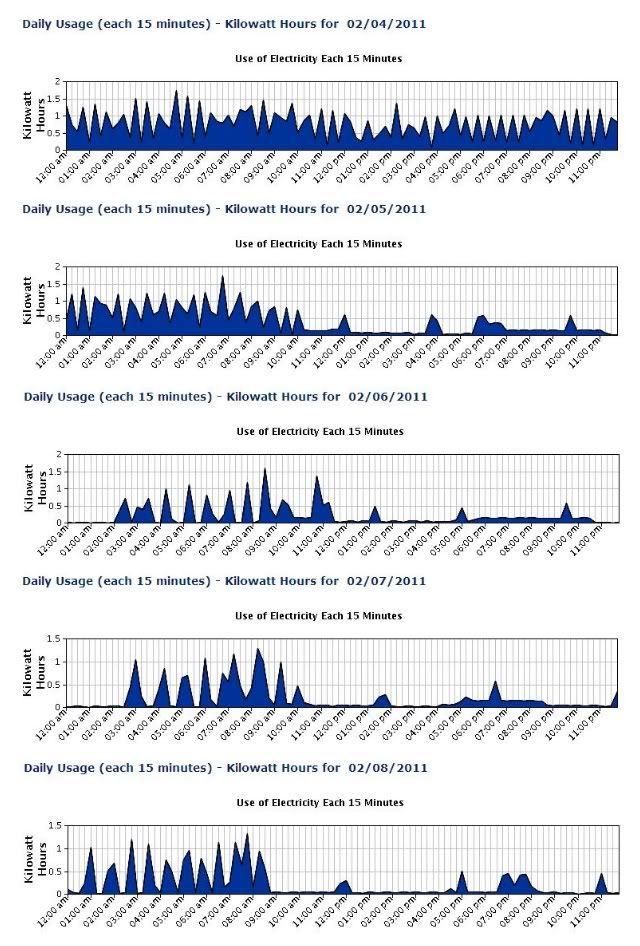
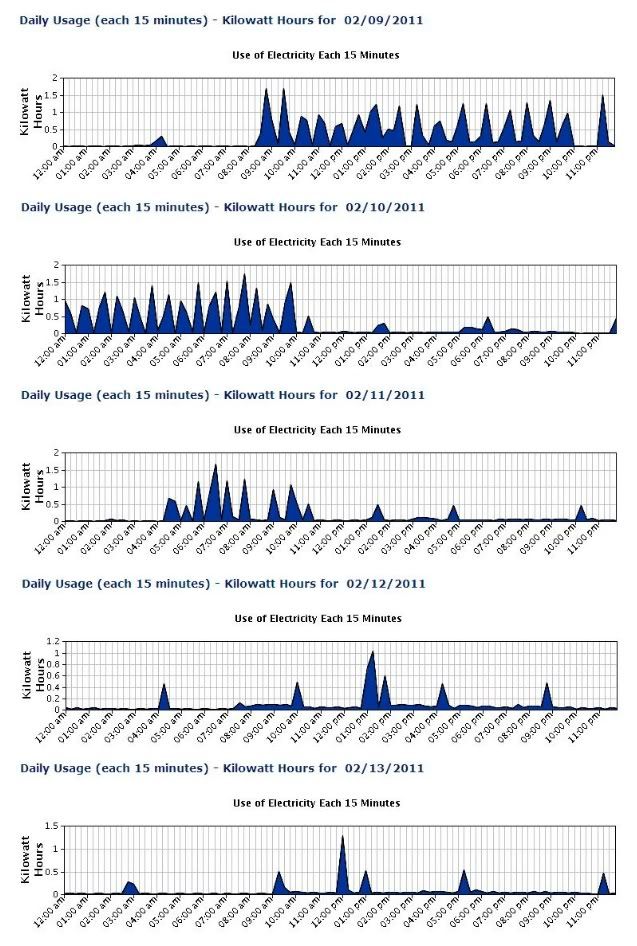
Oncor's answer was that it was cold on Feb 01,02,03 and 04 and so I showed them it was cold on Feb 09 and 10 as well but that didnt matter.
Revising My Evidence
I believe that smartmeters in Texas were used to steal from Texas residents. I can't prove that. I only know that my meter became incredibly inaccurate and it all started the day before the Texas blackouts of 2011.
This diary expands on what Ive already shown in the other diary. This diary contains the graphics data for most of the winter as well as some other tidbits.
Im a former technician and I have a degree in electronics. Im not an expert but Im not uninformed. I was home during all days in question and I spent all last year making myself familiar with what constitutes normal usage readings. All of this puts me in a position to notice this problem.
The readings/data from my smartmeter for Feb 01 thru Feb 04 (even 05) are not normal.
First, look at this chart which shows my daily usage for the 6 month period surrounding the days in question:
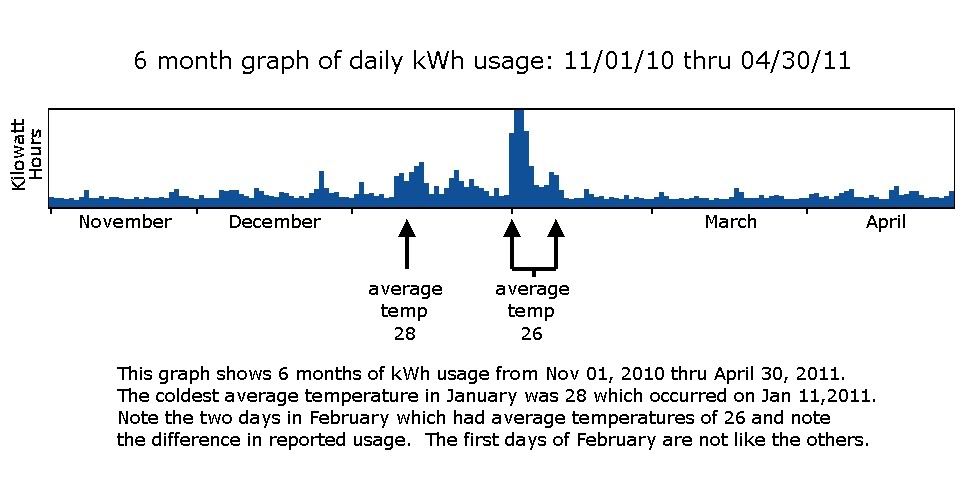
See how the first four days (second arrow) in February stand out? The temperature was not all that different. We are talking about two to three times the normal usage. Its more than twice the usage that occurred during a nearly identical cold front a week later.
I was home during both of them and doing similar things. That first day on that chart thats noted with an average temperature of 28 degrees -- thats Jan 11, 2011. I used 25kWh that day. On Feb 01 (second arrow), my smartmeter claims I used 74kWh. The average temperature for that day was 26. My power company claims that that is the explanation for the usage but the average temperature of Feb 10 (third arrow) was also 26 and my usage that day was 31kWh (less than half) which is much more in line with previous usage.
All of this was given to the Texas PUC (even more actually - I cant share everything I want to) but they gave me the non answer you see above. I hope somebody in authority takes note of this. The PUC expects me to complain to the city next but Ive informed them and its their job to regulate.
How to read these graphics
Each day has its own chart. On the left of each chart, you see a scale that reads "Kilowatt Hours".
The Kilowatt Hour is the product of wattage (in kilowatts) and hours. A 2,000 Watt device run for 15 minutes continuously will result in a '.5kWh' reading on the chart. 2,000Watts is 2kilowatts and 15 minutes is .25 hours therefore:
2kW * .25h = .5kWh
At the bottom of each day's chart, you see time in hours. Each chart has grid lines so you can find any particular 15 minute reading. The chart plots actual energy consumption from the start of the day through the end of the day. You can see what I was consuming at any point in time by looking at these charts.
Note that the scale on the left changes from chart to chart. Pay attention to the '.5kWh' line that goes across each day's chart. Note just how much of my energy use is below that threshold.
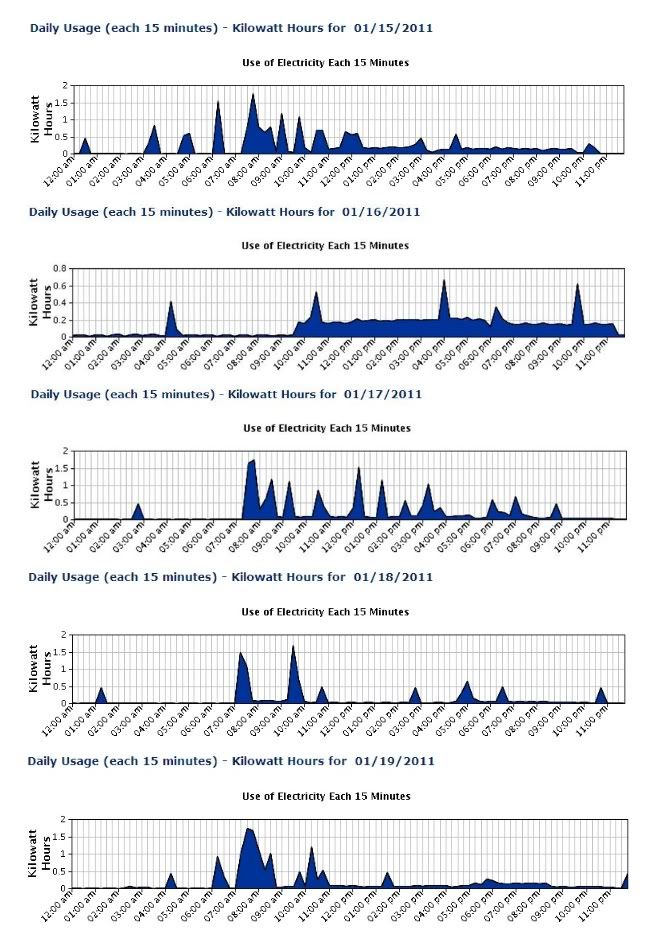
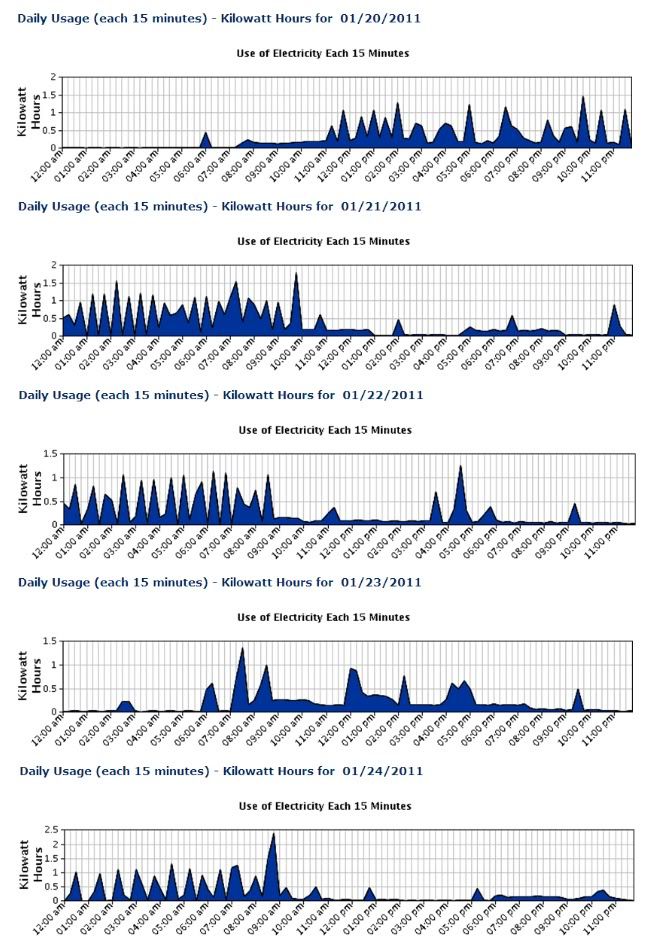
Look through all of these days and see if can find the ones that are not like the others.
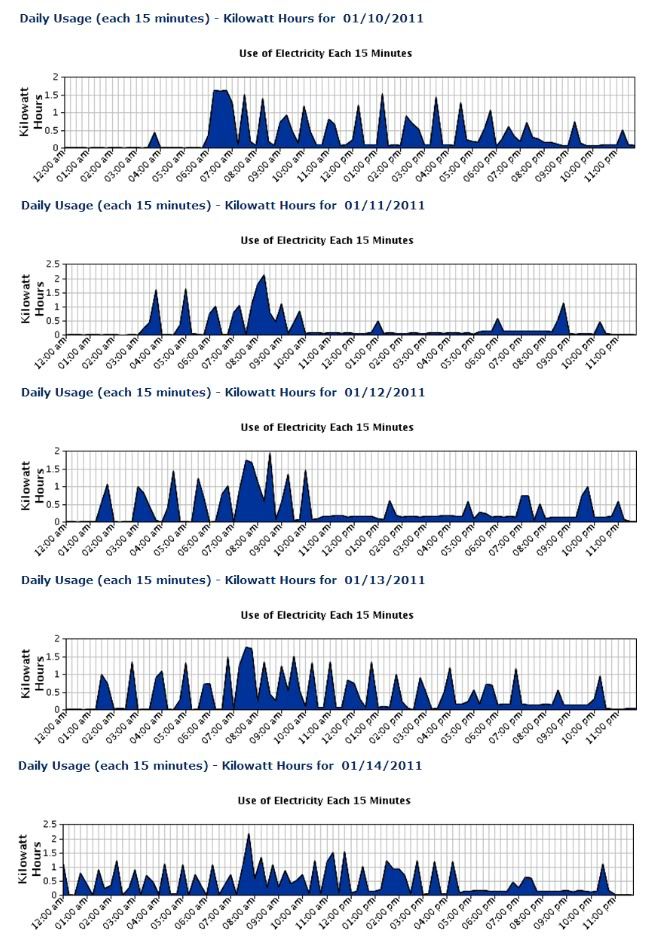
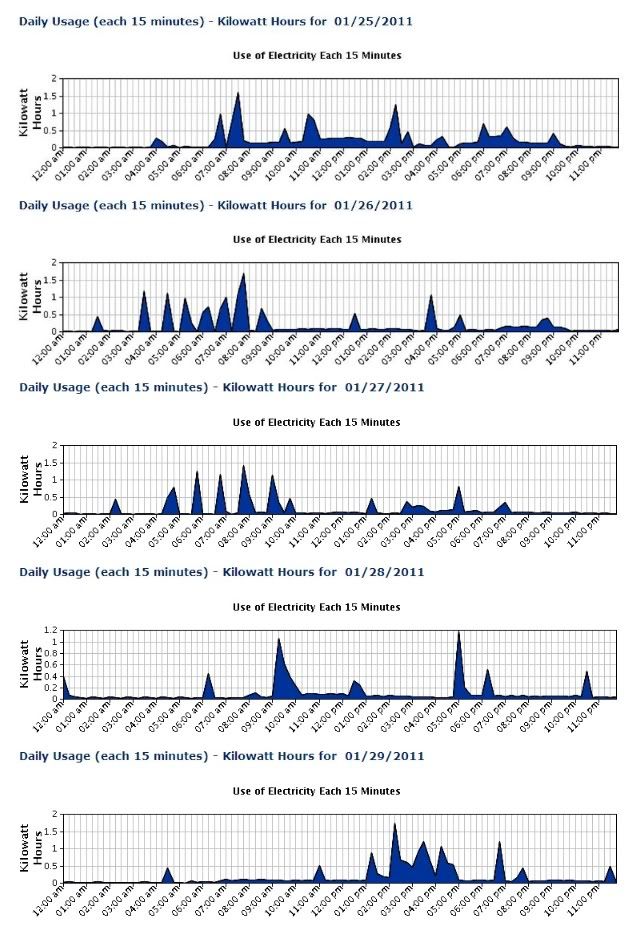
OK...we start at the beginning...Jan 10,2011. At 6am you see a block of energy use. This is what it looks like when I force my central heater to run continuously for an hour. This is the sum of my heater plus all other items that were running during that time. An 'energy plateau' is created becasue the heater uses its maximum amount while on and nothing while off.
Next, notice that most days have a period of greater energy use in the mornings around 7 or 8am. This is me getting up and turning up the thermostat and taking a shower or just washing my hair and face. The heater runs shorter cycles until it warms the place to the higher thermostat setting. Combine this with hot water use and you get the increased morning usage. Some days I dont wash my hair and face till later. Not all of these days even required heat.
Spikes represent higher levels of energy use. The spikes are not uniform becasue the length of time that either the central heater or hot water heater are on varies a bit and it pretty much never exactly coincides with the 15 minute segment that the smartmeter is paying attention to. The spikes that reach to '.5kWh' or higher are either hot water heater (individually seen as a .5kWh spike), central heater (indidvidually seen as approximately a 1.5kWh reading), or a combination of the two devices which results in higher spikes(above 1.5kWh).
The changing scale makes days like Jan 16th look strange. The spikes are my hot water heater and the long bar of usage is a combination of my space heater and most likely my television. You see the same usage on other days but the scale makes it look different. Jan 23rd is also unusual. Im not sure what all is going on there becasue I didnt log my activities on that day. (logging my activities was something I did/do in my efforts to learn how my applicances/devices show up in my smartmeter data). Jan 29th shows what I believe to be 'laundry'. It always makes a strange looking mountain in the data that consists of both spikes (hot water use) and rounded elements that are the dryer. Jan 25th at 6pm and Jan 31st at 7pm are typical of the dishwasher.
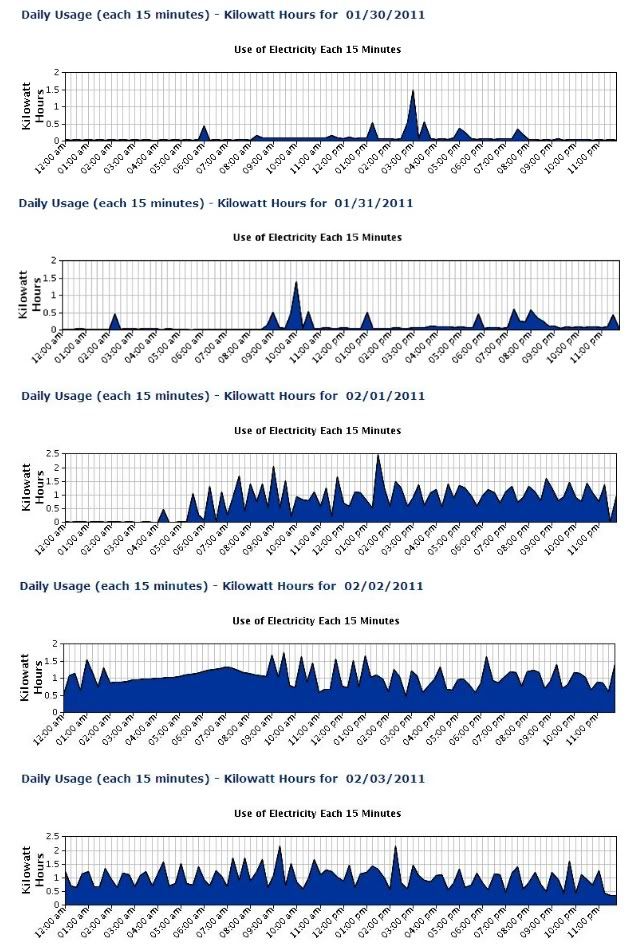
What remains a consistent truth is that spikes in the data are reserved for high energy users and when those high energy users shut off, the usage drops back below the '.5kWh' mark. (BTW - theres nothing sacred about that mark. Its just an easy eyeball mark which seperates out the major energy users in my home).
So now we come to what I find so strange in this data. Most of these days have spikes that are not uniform. Most of these days have the majority of their readings below that .5kWh mark. Its only the first few days of February where all or nearly all of the readings are above the .5kWh mark. This requires behavior from my apartment that is not supported by all the other day's data.
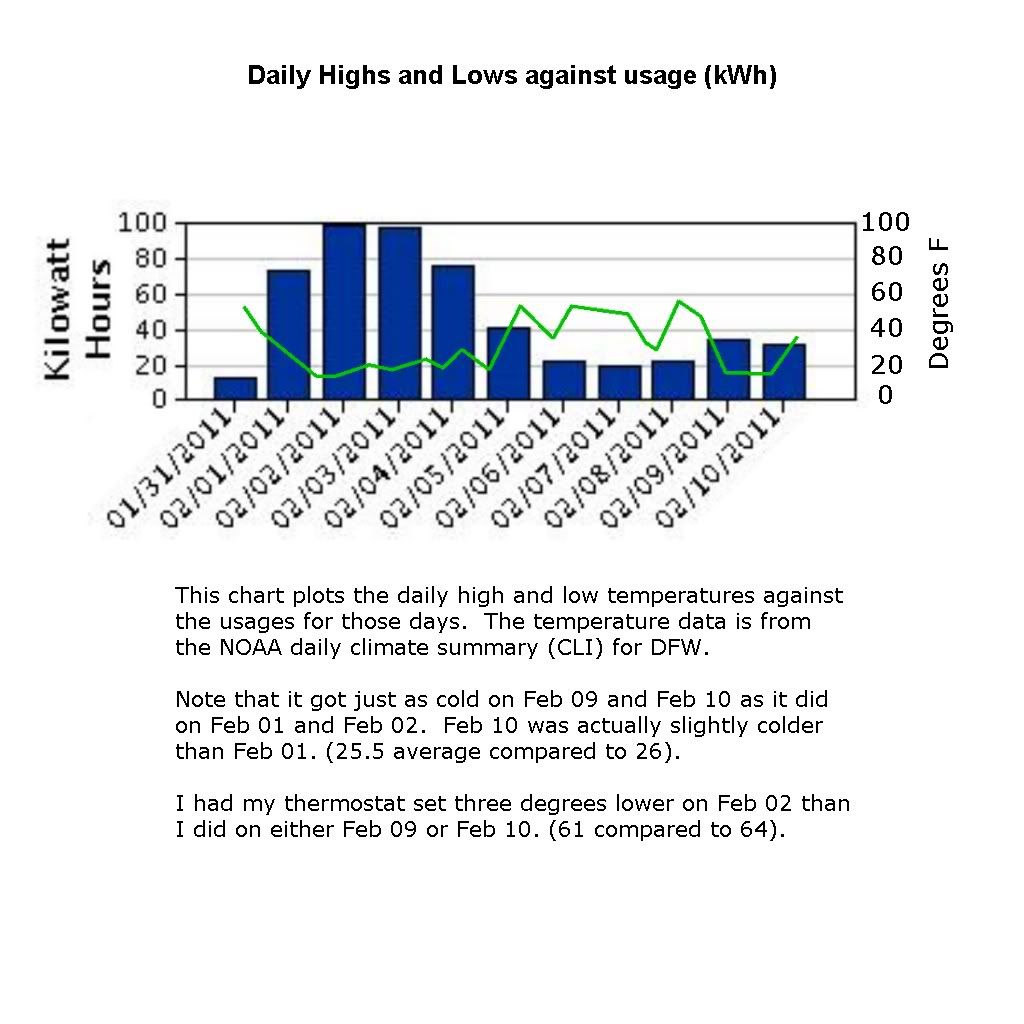
Here is a plot of my reported energy use against the daily high and low temperatures as reported by NOAA:
the actual data is:
Jan 31 day data:
MAXIMUM 53 410 PM 93 1911 56 -3 37
MINIMUM 38 1159 PM -2 1949 35 3 29
AVERAGE 46 46 0 33
feb 01 :
MAXIMUM 38 1220 AM 91 1911 56 -18 46
MINIMUM 14 1159 PM 6 1951 36 -22 29
AVERAGE 26 46 -20 38
feb 02:
MAXIMUM 20 1040 PM 83 1995 57 -37 51
MINIMUM 13 756 AM 7 1985 36 -23 38
AVERAGE 17 46 -29 45
feb 03:
MAXIMUM 23 1159 PM 84 1911 57 -34 47
MINIMUM 17 934 AM 14 1996 36 -19 35
1985
1905
AVERAGE 20 47 -27 41
feb 04:
MAXIMUM 29 332 PM 82 2008 57 -28 44
MINIMUM 19 650 AM 8 1996 36 -17 41
AVERAGE 24 47 -23 43
feb 05:
MAXIMUM 54 447 PM 85 1942 57 -3 59
MINIMUM 17 414 AM 12 1912 36 -19 39
AVERAGE 36 47 -11 49
feb 06:
MAXIMUM 54 255 PM 83 1925 58 -4 43
MINIMUM 35 802 AM 14 1982 37 -2 35
AVERAGE 45 47 -2 39
feb 07:
MAXIMUM 49 421 PM 88 1932 58 -9 44
MINIMUM 32 1159 PM 7 1933 37 -5 36
AVERAGE 41 47 -6 40
feb 08:
MAXIMUM 56 339 PM 85 1962 58 -2 42
MINIMUM 29 508 AM 2 1933 37 -8 38
AVERAGE 43 48 -5 40
feb 09:
MAXIMUM 47 1202 AM 87 1960 59 -12 43
MINIMUM 16 1047 AM 11 1933 37 -21 26
AVERAGE 32 48 -16 35
feb 10:
MAXIMUM 36 532 PM 85 1954 59 -23 39
MINIMUM 15R 707 AM 16 1981 38 -23 29
AVERAGE 26 48 -22 34
You can see that it was 16 degrees at 1047am on 02/09. It was cold. It fell to a record low of 15 on 02/10.
The low of 02/02 was 13 degrees and it spent much of 02/01 hovering around 20 degrees just like it did on 02/09.
I was home during all this time and I was doing similar things. I actually used less energy on 02/02 becasue I had my thermostat 3 degrees lower becasue I was asked to conserve and thats what I did.
but my smartmeter seems to indicate otherwise. and so I think it lied.
Please see my other diary on this as well.(link at top)
UPDATE 1
BTW - This is not about money. This is about meter accuracy.
It is vitaly important that all of the devices we rely upon in our lives tell the truth and treat us fairly. Anything less is an unfair weight or measure. We would get lost quickly if we let our devices be inaccurate. Consider if your speedometer said you were doing 85 when you were actually doing 50? Or if the grocery checkout said you bought 1.2 pounds of beef when in fact you only bought .8 pounds?
Its important that all of this be accurate both for us in the present and for the historical record.
UPDATE 2
One thing I think that gets lost when talking about the Texas blackouts is that it was quite warm during the week leading up to the first cold front. It was 75 degrees on both Jan 28th and 29th and it was 69 on Jan 30th. The high for Jan 31 was 53.
There should have been some residual heat to dampen the cold fronts effects.
The high temperatures leading into the second cold front were only in the 50s but still my usages were much less.
things that make you go hmmmmm...
UPDATE 3
FERC issued a report on the southwest power outages (aka Texas blackouts) and they downplay the weather on Feb 09 and 10.
Not sure why.
