Aug 17, 2011: This Diary has undergone a substantial rewrite but key points are the same
The Texas blackouts of February 2011 have convinced me that smartmeters are not completely reliable. I believe they can be manipulated to show more energy usage than has actually occurred. Its an issue that can affect anyone with a smartmeter and that's the purpose of this diary.
A smartmeter is one of those new electric meters (actually I think they can be used for natural gas as well) that replaces the old mechanical style meters. Around here we were told that the new meters were more reliable and accurate than the old ones. We were told that we would benefit from the advanced energy reporting features of the new meters in that we could learn how our daily habits effect our energy consumption. We were told we could lower our energy bills through awareness.
The first thing I noticed after a smartmeter was placed on my home is that my reported energy usage started to climb. It didnt happen all the time. It just seemed as though the smartmeter was much more sensitive or something. I believed what they said about the new meters being more reliable and accurate. I felt uncomfortable with the new meter but I accepted it must just be me and that I had to find ways to cut back.
A Cold Front Changed My Mind
A cold front came through here in Dallas Texas at the beginning of February 2011 and it was very cold. But it wasnt the first time its been cold here in Dallas and it wasnt the last cold front of February either. We had a similar one a week later but my smartmeter said I used much more energy for the first one as for the second one. It also didnt show the power failures that occurred on feb 02, 2011.
My meters usage data for February 01 through February 04 of 2011 is highly questionable for several reasons and thats what this diary is about. If you have a smartmeter, examine my evidence and consider your own situation.
About Me
Im a moderately energy concious person. Im a single person living in a small one bedroom apartment. I only use low wattage CFL's. I try to not have more than one light on at a time. I pay attention to my energy use.
Im a former electronics technician. I have an associates degree in electronics. I don't know everything but Im not uninformed either. My background gives me some standing here.
I was home during all of the occassions in question and I was doing similar things which means the energy usages should be similar.
When my smartmeter first hit me with what I considered to be abnormally high readings, I took advantage of a website that exists in my area that allows me to have access to my meters usage data. The website was set up by three companies in my area who are responsible for the smartmeters. You will hopefully have access to the same data in your area. Ask the company who is responsible for your smartmeter. They can tell you how to get the usage data if its available to you.
How This Started - Why This Diary Exists
The power first went out sometime around 2 or 3 am on February 02, 2011. I dont really know. I only know that my smoke alarm woke me with its 'chirping'. It chirps when the power goes out.
After a while it shut up and I fell back asleep. I next woke up when my smoke alarm 'screamed'. It does that when the power comes back on. It was on for a short while and then went back out again.
The next thing I remember was when I woke up and it was before time to get up. The power was off. The power came back on for a short while and then went back out again. It was then that I got the first of two phone calls telling me about the blackouts and that I should conserve.
I unplugged everything I own and got back into bed. After a bit the power came back on and I decided it was a good opportunity to make coffee and try to get some heat in the apartment. I set the thermostat at 64 and let it run for a while. When coffee was done and the heater had gone through its cycle, I unplugged the coffee maker and set the thermostat back to 61 and turned on my space heater to its 400Watt setting and proceeded to listen to the clock radio and do paperwork all day. I was within a few feet of my heater (its a small apartment) and I know it didnt come on that much.
Curious About the Data
I remember being both curious and concerned about what my smartmeter would claim my usage was. I knew it had to be low becasue I was using so little energy but I was also convinced that smartmeters didnt handle power failures well.
I first tried to get online on Saturday 02/05/2011 but the website was having problems of some kind. My username and password would not work. I had to call them and let them know. The phone call went rather strangely.
I called and a voice said "Hello,this is Lewis. May I help you?" and I said "Hello Lewis" and I began to tell him of the website problems. And he said "Hello, this is Lewis. May I help you?" and I said "Lewis. Can you hear me?" and then I got silence and then he hung up on me and so I called back and a different guy answered and I immediately said "Can you hear me?" and he said "Yes, I can hear you" and so I told him that the website was having problems and that "known good usernames and passwords were not working" and he said OK. I waited a few days and then got online to see my usage data.
I was stunned
My meter said I set a new record for energy use that far exceeded my old record. It didnt show the power failures that had occurred.
My old record was 61kWh.
The meter says I used 99 kWh on feb 02;
72kWh on Feb 01; 97kWh on Feb 03 and 76kWh on Feb 04.
My smartmeter had claimed I used 344 kiloWatthours of energy in just four days. I have six years of electric bill history to show that for 15 of the last 78 months, I have used 350kWh or less for the entire month. I dont use a lot of energy. When its either too hot nor too cold I can get by on about 10kilowatthours per day. I have a long history to show that.
Look at this graph that shows all of daily usages for the six month period surrounding the beginning of February 2011:
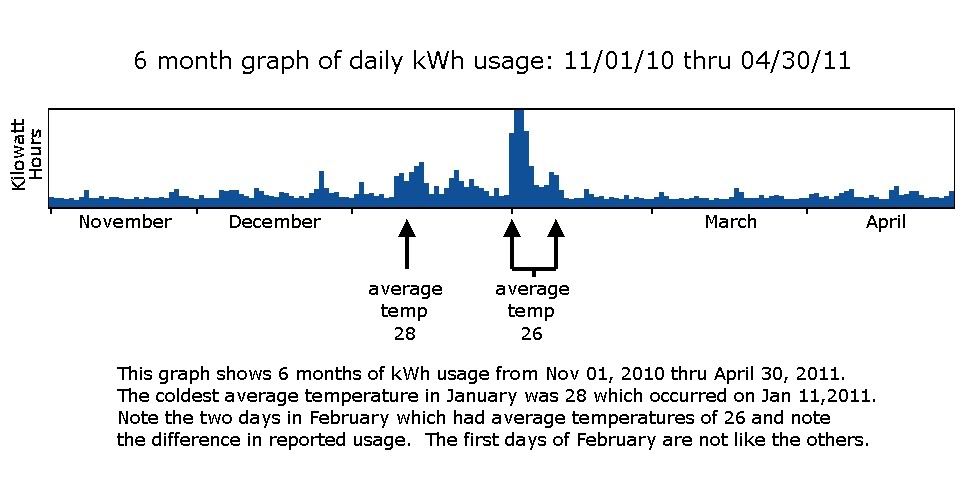
48% of my reported February energy usage comes in just four days.
28% comes on Feb 02 and 03 alone.
The previous record high (which I also found questionable but just decided it must just be me) was set on a day last year when I just got sick of being cold and I set my thermostat at 72. After seeing last years 61kWh reading, I decided that this year I wouldnt set the thermostat above 65.
Its been at 64 or 61 for almost the entire winter. Using less heat is my only defense against the high cost of energy. I figure that I can use less and pay less.
But here I have a situation where I conserved as much as possible and I get hit with record usage claims. On a day when the power was out for a several hours and I had everything unplugged with my thermostat set to 61, my smartmeter claims I used 163% more energy than I ever did before.
Deciphering the Data - Noting the Oddities
I found my usage to be far out of line. It doesnt make common sense that a person would set a record for energy use on a day when the power was out for several hours and that I was conserving by keeping the thermostat low.
I knew that only my central heater and/or my hot water heater could be responsible for the use. There aren't many items in my apartment. The hot water heater runs on its own schedule and its usage is included in every single days data. The hot water heater's usage is included in both Feb 09 and 10 for example. The central heater is my main energy user during the winter.
I had to find out how big my central heater was. Luckily, the smartmeter itself provided indirect answers in two different ways. First, my hot water heater says its 5500Watts and my smartmeter says the maximum wattage its ever delivered is 11,810Watts. The smartmeter has held that same reading for over a year now and I'm sure it must have been set after a power failure. The difference between those values leaves 6,310 Watts for everything else that was plugged in at that time.
The second answer comes from the smartmeter data for Jan 10,2011. I ran my heater for an hour and it produced a near constant level usage reading which implies the heater is just over 6,000 watts.
Next, I wondered how often my heater actually ran. I thought of that on the morning of Feb 09, 2011 which luckily (or Blessedly) turned out to be the first day of the second cold front.
I kept track of my heater all day long and found that with the outside temperature of 20 degrees and with it being cloudy and a strong north wind and with my thermostat set at 64 degrees, my heater would run an average of 27% of the time.
This blew my mind. The data for the beginning days of February required my heater to run an average of 60 to 68% of the time but here I find that my heater is capable of heating my apartment on a 20 degree day while only running 27% of the time.
A few days later, I got back online to get the data for February 09 and 10 and I was pleased to see that it looked like data that I was used to seeing. It also agreed with the heater log that I had created which tends to verify both of them.
Two Similar Cold Fronts
What I now had was data taken during two very similar cold fronts and the knowledge of what my central heater actually did during the second one. I went to NOAA's DFW site to get the relevant temperature information.
It was 'warm' on Jan 31 and a cold front came through and by the early morning of Feb 02 it was 13 degrees. It was similarly 'warm' on Feb 08 and a cold front came through and it reached a record low of 15 by the early morning of Feb 10.
It was 53 on the afternoon of Jan 31 and it fell to 13 in the early morning of Feb 02.
It was 56 on the afternoon of Feb 08 and it fell to 15 in the early morning of feb 10.
Both cold fronts started the same. The difference was in how long each lasted but my heater doesnt know or care that it will be cold tomorrow. It only knows if its cold right now. It was able to heat my apartment on both Feb 09 and Feb 10 while using much less energy than my meter claims I used for Feb 01 thru Feb 04.
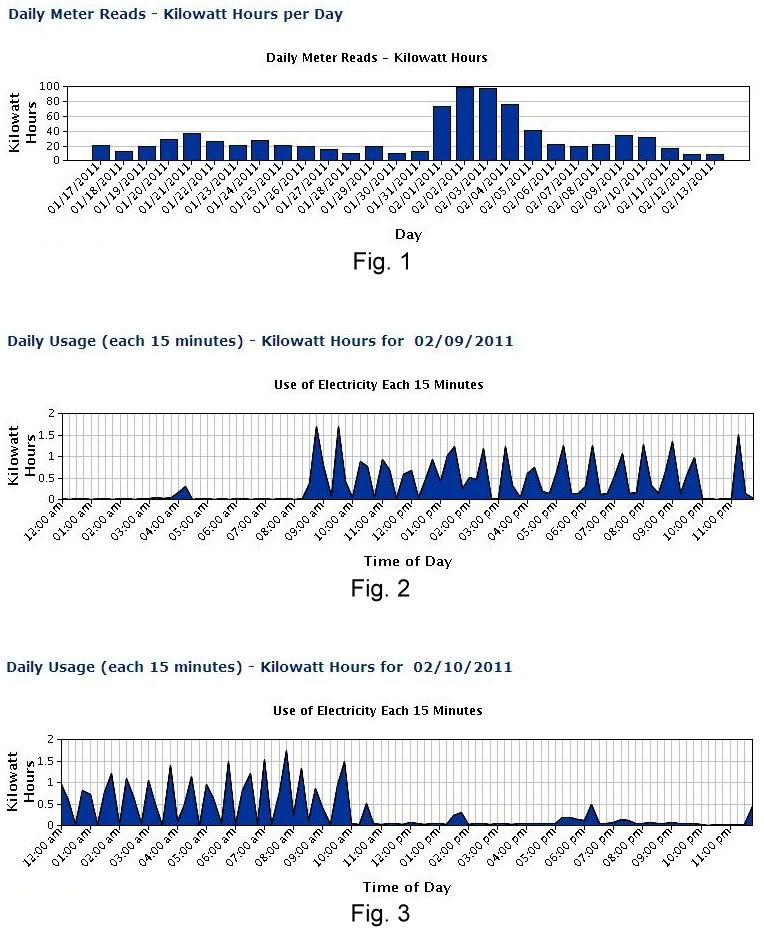
Look at the following graphic. Fig.1 shows my daily usage readings from Jan 17 to Feb 13 of 2011. Note the usage for Feb 09 and Feb 10 and compare it with the usage for Feb 01 and Feb 02.
Troughs in the Data
Fig. 2 shows my usage data for Feb 09. It shows that my electric heater didnt even come on until 8:45am. You can see its usage throughout the day. There are spikes where it was on and troughs that come down near zero when it was off.
My radiant space heater has two settings: a 400Watt setting and an 800watt setting. On feb 09, I ran the space heater at its 400Watt setting from 4pm to just before 10pm. You can see it in the data. Note how the 'troughs' dont come down as far during that time. I set the thermostat at 61 and turned everything off and went to bed at 10pm on Feb 09.
Fig. 3 shows how my heater acts when its 15 degrees outside and the thermostat is set at 61. Again note how the troughs in the data come down to nearly zero. This data should have been replicated throughout the Feb 01 through Feb 04 time period but its not. I dont run the space heater at all during the night.
February 01 thru Feb 04
The data for Feb 01 through Feb 04 shows a strange increase in 'baseline usage'. The troughs in the data start to climb on feb 01 and they stay high through Feb 02 and Feb 03 and then they very gradually decline through Feb 03 and Feb 04.
Look at the following graphic. Note how you can almost draw a line from 10am on Feb 01 to the interpolated (extrapolated?) peak at 7am on Feb 02 and then downward to 11am on Feb 02. From there it seems to go back up but becomes hidden.
(blunami - yes there should be zeros but no, the peak is not the power coming back on -- everything above the zero mark on the scale at the left is 'power on' according to the meter -- thats one reason why I say there is no power failure in the data)
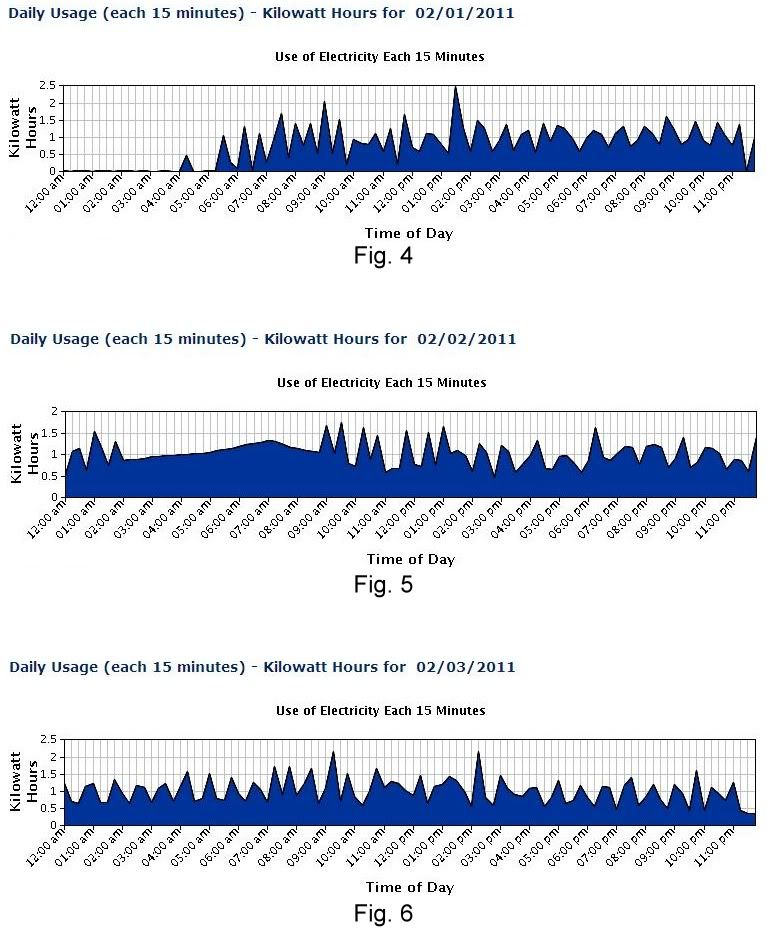
Notice the interpolated segment on Fig 5 (Feb 02) from 2am to 8:45am. This covers the power failures. My power company has told me that they took the difference between two known good readings and then used a 'profile' to fill in the missing data.
The missing data covers 7 hours or 29% of the day. The estimated usage data claims that 30.519kWh (or 30% of the days total) were used during this time.
This might be OK if there were no power failures because the rate of energy consumption per hour would be constant and consistent throughout the day but what we know is that there were power failures during this time.
My power company says the power was out for two hours. I'm sure its at least three.
Subtracting the 3 hours from the 7 hour window and we are left with a 4 hour time period during which 30.519kWh were consumed.
30.519 divided by 4 = 7.63 kiloWatts on average that would have to be consumed every single second for that four hour period. My heater is only 6 kiloWatts.
This level of consumption is very unlikely. If the power didnt go out until 5:45am like my power company tells me, then it is impossible becasue a shorter power failure means less abnormal behavior from my hot water heater or central heater and not more.
Conversly, a longer power outage leaves less time for power to be consumed.
Neither my power company nor the PUC of Texas have been able to explain any of this to me. Neither of them go any further than to say that the temperature was responsible for my energy use and Ive already shown that that is not the answer.
My Conspiracy Theory
They say we set usage records on Feb 02, 2011.
I dont think we did.
I think someone with know how took advantage of the smartmeters two way communication feature to manipulate the market on the demand side. It has many advantages. First, it validates the appearance that supplies are tight and this increases wholesale elctricity prices. Second, this volatility helped increase prices on everyone whether they had a smartmeter or not. Third, all of the 'lines companies (the TDSPs)(the people in charge of the smartmeters) got more money out of the deal becasue they get a fee thats based on how much energy you use.
Who needs to mess with supply when you can create artificial demand?
Id love to see everyone else's usage data for the beginning days of Feb 2011. Id love to see if everyone with a smart meter has an increase in their usage for those days. Everyone in Dallas should compare their usage for Feb 01 and 02 with that of Feb 09 and Feb 10. Compare the early morning hours of Feb 10 with Feb 02. They should be the same (shouldnt they?).
Note that it has been pointed out to me by texasmom that her usage should be different becasue they were home on feb 01-04 but back at work on Feb 09 and 10.
I was home on both occassions and doing similar things.
Please look into your own situation and become familiar with your energy use. There's something not right here. There should be a website in your area or some means for you to get your smartmeters data if you have one. Take advantage of it. Protect yourself. Knowledge is power.
I doubt Im the only one this has happened to and thats why I need to help point this out.
an FYI on the KiloWattHour
Note - the following is just an FYI about the kiloWatthour that you should know about but I cant seem to fit it into the diary anywhere...
Power is measured in Watts. The kiloWatthour is the product of power (in kiloWatts) and hours that the power was used. One kiloWatthour is 'one kiloWatt of power consumed for a period of one hour'. All you need to find the number of kiloWatthours (kWh) that a given device should add to your daily total energy usage is the number of Watts of that device and the number of hours that device is on.
A 1,000 watt space heater run for one hour uses 1kWh of energy. If you run it for ten hours, you would use 10kWh.
A 100Watt lightbulb run for one hour uses .1kWh. That same lightbulb run for ten hours uses 1kWh of energy.
Take the wattage of the device and multiply by .001 and then multiply by the number of hours the device is on and you get the kiloWatthours that device will add to your total days usage.
For example, my 6,000Watt heater:
6,000Watts times .001 = 6kW;
6kW times 24 hours = 144 kWh
If my heater was run constantly for 24 hours, it would add 144kWh (assuming its exactly 6kW)
(Note that this is another reason why 99kWh seems high to me)-especially since the power failures shortened the day by several hours
UPDATE
the update to this diary containing more graphics
a FERC report on the Texas blackouts
