I previously did a diary about what maps I thought we should have drawn for Illinois and Arkansas. Now, I'll critique the GOP's map-drawing in Indiana, Oklahoma, and Nebraska. Because the Obama-McCain numbers don't accurately reflect Oklahoma's political landscape, I calculated numbers from the 2004 Tom Coburn-Brad Carson Senate race, which Coburn won 53-41. For Nebraska, the Obama-McCain numbers are not in DRA, so I calculated them, as well as the 2008 Mike Johannes-Scott Kleeb Senate race, which Johannes won 58-40. The Kleeb numbers show about what a strong rural Democrat would likely get and illustrate the safety of the new 1st and 3rd districts. The lone exception is the 2nd, which is more suburban, so the national Democrats usually perform better than the local Democrat.
Indiana:
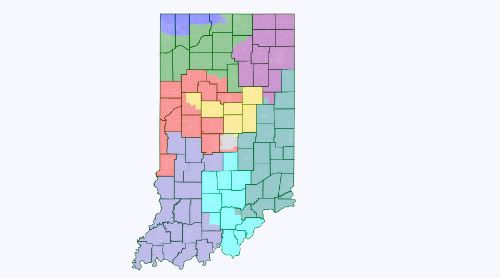
Actual Map:
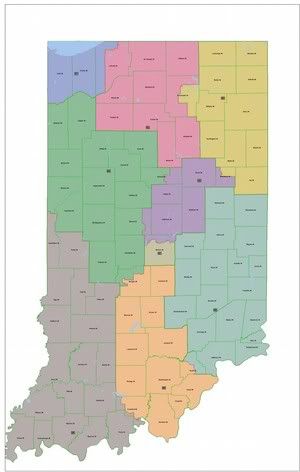
IN-1 (blue): Pete Visclosky (D-Merrillville)
In my version, I add South Bend to help out the 2nd, as the 1st is a Dem vote sink already. The PVI would increase from about D+8 to around D+12.
White: 59.4%, Black: 22.8%, Hispanic: 14.6%
VAP: White: 64.2%, Black: 21.1%, Hispanic: 12.2%
Obama: 67.6%, McCain: 31.5%
Actual: Obama 63.3%, McCain: 35.8%
Safe D
IN-2 (green): Open
By losing South Bend and adding a bunch of rural conservative counties, it's pretty much a guaranteed Republican pickup. What they actually did was nip around the edges and bring the Obama percentage down from 54% to 50.6%. The Republicans will likely pick this up regardless, but my version makes it easier without harming the other districts. The PVI would swing from R+2 to about R+10. The reason they did it this way was to draw a district for 2010 loser Jackie Walorski, who lives in South Bend, but it makes much more sense to just draw a safe district, rather than one for a specific person.
White: 86.2%; VAP: White: 88.6%
McCain: 53.7%, Obama: 45.2%
Actual: Obama: 49.6%, McCain: 49.3%
Safe R
IN-3 (purple): Marlin Stutzman (R-Howe)
Minimal changes in my version. In both versions, it expands to add some rural areas to the south in order to make up for population loss.
White: 85.2%; VAP: White: 87.8%
McCain: 56.2%, Obama: 42.8%
Actual: McCain: 56.0%, Obama: 43.0%
Safe R
IN-4 (red): Todd Rokita (R-Indianapolis)
This suburban district is probably the major difference in my map. My version nabs Democratic Vigo County to help shore up the "Bloody Eighth," while still somehow ending up with a slightly higher McCain percentage than the real version. It might lose a point or two from its current R+14 PVI, but is still safe for Rokita.
White: 88.0%; VAP: White: 89.9%
McCain: 54.4%, Obama: 44.5%
Actual: McCain: 54.2%, Obama: 44.6%
Safe R
IN-5 (yellow): Dan Burton (R-Indianapolis)
In both versions, it loses some rural counties to the 2nd and 3rd in order to screw the corrupt Burton in a primary. Former Marion County Coroner John McGoff, who lost to Burton 52-45 in the 2008 primary and placed 3rd with 19% in the 2010 primary has announced he will try a third time. Former 3-term Rep. David McIntosh, last seen losing the 2000 gubernatorial election, has formed an exploratory committee, and former US Attorney Susan Brooks is also running, so we may see another repeat of 2010, where Burton was able to skate through a 7-way primary with just 30% of the vote. If that indeed happens, it's conceivable a very strong Democrat would have an outside shot in the general, but it is still highly unlikely. The PVI drops from R+17 to about R+11, which is still pretty safe, even for Burton.
White: 84.8%; VAP: White: 86.7%
McCain: 53.5%, Obama: 45.6%
Actual: McCain: 52.6%, Obama: 46.6%
Likely R for Burton, Safe R otherwise
IN-6 (teal): Open
This is another district that is pretty much the same in both maps. With Mike Pence running for governor, the 6th is now open and a whole host of candidates are running. The main candidates are former state Rep. Luke Messer, who finished 2nd with 28% in the 2010 IN-5 primary and looks like the frontrunner, and teabagging developer Travis Hankins, who fell just 3% short of winning the 2010 IN-9 primary. The PVI increases slightly from R+10 to about R+12, and considering Pence never fell below 60% in the old incarnation, it's safe Republican.
White: 93.7%; VAP: White: 94.7%
McCain: 55.0%, Obama: 43.5%
Actual: McCain: 55.0%, Obama: 43.6%
Safe R
IN-7 (gray): André Carson (D-Indianapolis)
The Indianapolis vote sink remains safe for Carson, with the PVI remaining around its current D+14.
White: 53.8%, Black: 31.1%, Hispanic: 10.5%
VAP: White: 58.8%, Black: 28.9%
Obama: 69.4%, McCain: 29.9%
Actual: Obama: 66.3%, McCain: 32.8%
Safe D
IN-8 (slate blue): Larry Bucshon (R-Newburgh)
The "Bloody Eighth" gets shored up for Bucshon in my version by losing Democratic Vigo County, improving its PVI from R+8 to about R+10. This would make it just out of reach for a Democrat in a wave year, whereas the current version keeps it as a swing district that could see Bucshon lose, perhaps even in 2012 to a strong Democratic challenger.
White: 92.7%; VAP: White: 93.9%
McCain: 53.5%, Obama: 45.2%
Actual: McCain: 50.6%, Obama: 48.1%
Safe/Likely R
IN-9 (cyan): Todd Young (R-Bloomington)
Young is shored up in both versions, with the PVI going up from R+5 to R+7 in my version and R+8 in the real version. Plus, with teabagger and 2010 primary candidate Travis Hankins drawn into the 6th, Young gets shored up in a primary as well.
White: 90.0%; VAP: White: 91.3%
McCain: 52.2%, Obama: 46.8%
Actual: McCain: 52.7%, Obama: 46.2%
Likely R
Oklahoma:
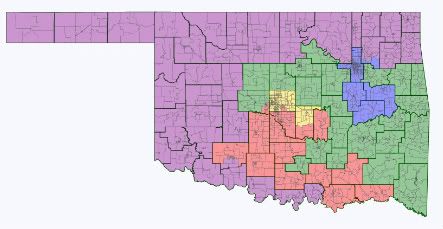
Actual Map:
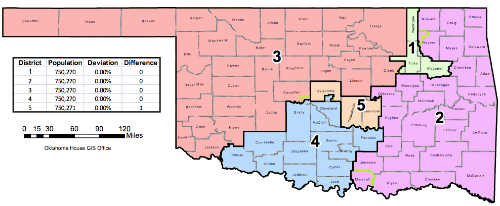
OK-1 (blue): John Sullivan (R-Tulsa)
The Tulsa-based 1st adds Muskogee County, where both Dan Boren and former 4-term Attorney General and 2010 Democratic Gubernatorial Primary loser Drew Edmondson live. The district stays about the same at R+16 PVI. After first winning a 2002 special 54-44 and then winning the general 56-42, he hasn't received below 60% in any election, so he's probably fine, even if Boren hypothetically didn't retire and decided to run against him.
White: 64.8%, Black: 10.1%; VAP: White: 69.5%
McCain: 63.1%, Obama: 36.9%; Coburn: 54.1%, Carson: 42.5%
Safe R
OK-2 (green): Open
Dan Boren and Drew Edmondson get drawn into the 1st and Brad Carson is drawn into the 3rd in my map, plus the district loses many ancestrally Democratic counties. The PVI won't change very much from its current R+14, but it will lose a bunch of conservative Democrats who would still vote Democratic at the local level. Dan Boren isn't seeking re-election, but they did not know of this at the time the map was made, which makes it even more incomprehensible that they didn't tear apart this district. Just a reminder, in this very district Brad Carson won 55-42 in 2000 and was re-elected 74-26 in 2002. In his 2004 Senate run, he won the 2nd 56-39, against Tom Coburn, who also represented the 2nd for 3 terms. Plus, a PPP poll from early June had him up 43-35 over GOP State Rep. George Faught before he decided not to run, a big break for the Republicans. However, former state Sen. Ken Corn also leads Faught 37-36, so the GOP may have let us hold this seat by not tearing apart the 2nd.
White: 72.3%, Native: 13.0%; VAP: White: 76.0%, Native: 11.5%
McCain: 69.9%, Obama: 30.1%; Coburn: 50.1%, Carson: 44.4%
Likely R
OK-3 (purple): Frank Lucas (R-Cheyenne)
The 3rd is anchored by all the deep red counties in Western Oklahoma and the Panhandle, which allows it to absorb many other historically blue counties from the 4th, which in turn takes some from the 2nd. The PVI is still around R+24. Lucas is entrenched here, having received at least 64% all but once, when he got 59% in 2000, back when he represented the now-defunct 6th district.
White: 71.7%; VAP: White: 75.8%
McCain: 71.6%, Obama: 28.4%; Coburn: 51.5%, Carson: 42.1%
Safe R
OK-4 (red): Tom Cole (R-Moore)
Anchored by the dark red Oklahoma City suburbs, it swaps some ancestrally Democratic counties in the west to the 3rd and in turn takes some from the 2nd. Cole hasn't fallen below 65% in any re-election campaign after first winning 54-46 in 2002. The PVI stays around R+18.
White: 74.2%; VAP: White: 77.6%
McCain: 68.0%, Obama: 32.0%; Coburn: 53.4%, Carson: 38.6%
Safe R
OK-5 (yellow): James Lankford (R-Oklahoma City)
The Oklahoma City-based 5th changes little and remains safe for the freshman Lankford at around R+13.
White: 60.3%, Hispanic: 14.5%, Black: 14.1%; VAP: White: 65.2%, Black: 13.3%, Hispanic: 11.6%
McCain: 60.8%, Obama: 39.2%; Coburn: 54.8%, Carson: 38.2%
Safe R
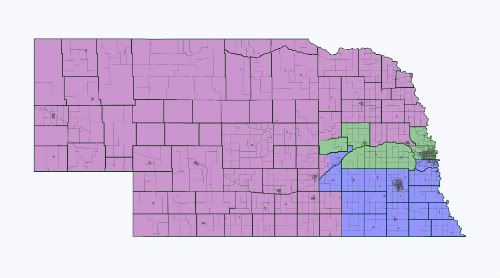
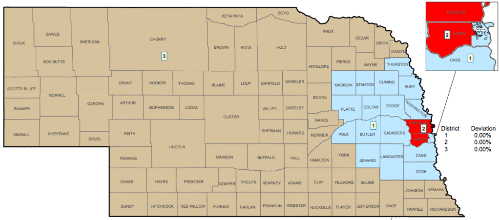
Nebraska:
Actual Map:
NE-1: Jeff Fortenberry (R-Lincoln)
His district gets 1% weaker in my version, but it doesn't matter too much, since Fortenberry has comfortably won each of his elections, especially the past two: 54-43 in 2004, 58-42 in 2006, 70-30 in 2008, and 71-29 in 2010.
White: 86.6%; VAP: White: 88.9%
McCain: 53.1%, Obama: 45.1%
Johannes: 54.6%, Kleeb: 43.1%
Actual: McCain: 54.1%, Obama: 44.0%
Safe/Likely R for Fortenberry; Safe R for Presidential Election
NE-2: Lee Terry (R-Omaha)
McCain would have won my version by 3281 votes, while Obama won the real version by 3126 votes, so the percentages flip. Obviously its still winnable for Obama, but there is no reason not to make it a McCain district. Many citizens flipped out over the real change, not because of the politics, as it only gave an additional 244 votes to McCain, but because they wanted Offut Air Force Base and the US Strategic Command Headquarters to be in a district with Omaha in order to get more federal attention. If they got mad about that, the reaction over splitting Douglas County would have been outlandish, so my version would be the most realistic thing they could do.
White: 74.9%, Hispanic: 10.4%; VAP: White: 78.9%
McCain: 49.8%, Obama: 48.6%
Johannes: 56.7%, Kleeb: 40.6%
Actual: Obama: 49.8%, McCain: 48.6%
Likely R for Terry; Lean R for Presidential Election
NE-3: Adrian Smith (R-Gering)
Takes some swingy and light red counties in the northeast, as it has to expand because of slow population growth.
White: 84.8%, Hispanic: 11.2%; VAP: White: 88.2%
McCain: 67.1%, Obama: 30.8%
Johannes: 61.4%, Kleeb: 36.3%
Actual: McCain: 66.9%, Obama: 31.0%
Safe R
